2 releases
| 0.1.1 | Dec 30, 2022 |
|---|---|
| 0.1.0 | Dec 30, 2022 |
#409 in Visualization
85,084 downloads per month
Used in 4 crates
(3 directly)
215KB
421 lines
termplot
An extensible plotting library for CLI applications.
Documentation
Find the full documentation on doc.rs
Quick start
To use termplot, add the crate to your Cargo.toml.
[dependencies]
termplot = "0.1.0"
Examples
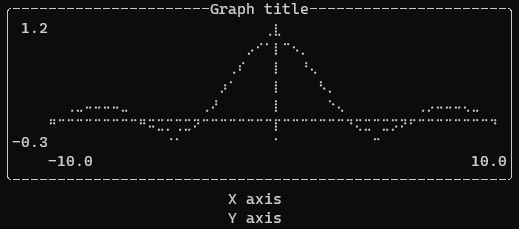
Plotting a function
Here is a quick example of what plotting sin(x) / x looks like.
use termplot::*;

let mut plot = Plot::default();
plot.set_domain(Domain(-10.0..10.0))
    .set_codomain(Domain(-0.3..1.2))
    .set_title("Graph title")
    .set_x_label("X axis")
    .set_y_label("Y axis")
    .set_size(Size::new(50, 25))
    .add_plot(Box::new(plot::Graph::new(|x| x.sin() / x)));

println!("{plot}");
Output of the previous example:
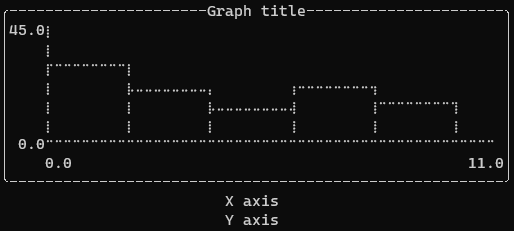
Historigram
use termplot::*;
use rand::Rng;

let mut rng = rand::thread_rng();
let values: Vec<f64> = (0..100).map(|_| rng.gen_range(0.0f64..10.0f64)).collect();

let mut plot = Plot::default();

plot.set_domain(Domain(0.0..11.0))
    .set_codomain(Domain(0.0..45.0))
    .set_title("Graph title")
    .set_x_label("X axis")
    .set_y_label("Y axis")
    .set_size(Size::new(50, 25))
    .add_plot(Box::new(plot::Historigram::new(
        values,
        vec![0.0..2.0, 2.0..4.0, 4.0..6.0, 6.0..8.0, 8.0..10.0],
    )));

println!("{plot}");
Output of the previous example:
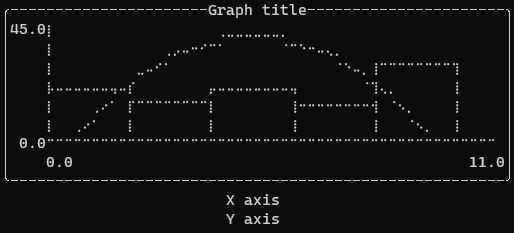
Composing multiple plots
It is also possible to compose multiple plots:
use termplot::*;
use rand::Rng;

let mut rng = rand::thread_rng();
let values: Vec<f64> = (0..100).map(|_| rng.gen_range(0.0f64..10.0f64)).collect();

let mut plot = Plot::default();

plot.set_domain(Domain(0.0..11.0))
    .set_codomain(Domain(0.0..45.0))
    .set_title("Graph title")
    .set_x_label("X axis")
    .set_y_label("Y axis")
    .set_size(Size::new(50, 25))
    .add_plot(Box::new(plot::Historigram::new(
        values,
        vec![0.0..2.0, 2.0..4.0, 4.0..6.0, 6.0..8.0, 8.0..10.0],
    )))
    .add_plot(Box::new(plot::Graph::new(|x| {
        -2.0 * (x - 5.0).powf(2.0) + 40.0
    })));

println!("{plot}");
Output of the previous example:
License
MIT - Enjoy!
Dependencies
~0.1–7MB
~34K SLoC