6 releases
| 0.1.4 | Mar 14, 2025 |
|---|---|
| 0.1.3 | May 7, 2020 |
| 0.1.2 | May 6, 2020 |
| 0.1.1 | May 5, 2020 |
| 0.1.0 | Apr 4, 2020 |
#68 in Profiling
144 downloads per month
10KB
212 lines
Readings is meant to get vital information for the health of a process.
![]()
![]()
It is made of two crates:
- readings-probe is the instrumentation bit that you must depend on and setup
- readings contains the executable that will make charts from the instrumentation output
I am trying to make it easy to get the kind of graphs I used in my blog post series a few years ago: http://www.poumeyrol.fr/2016/02/08/Hashes-to-hashes/ . Readings is not there yet, but the will is here.
Status
This is alpha, early work bazaar style. For instance, the probing code only compiles on Linux, Mac and Windows. And windows has only CPU instrumentation from the OS (help wanted from a Win32 guru for faults and mem usage :) ).
Quickstart
Instrument
In Cargo.toml:
[dependencies]
readings-probe = "0.1"
In your main, or just around:
// this is optional but the cost may be worth it. YMMV
readings_probe::instrumented_allocator!();

fn main() -> readings_probe::ReadingsResult<()> {
    // setup the probe
    let mut probe =
        readings_probe::Probe::new(std::fs::File::create("readings.out").unwrap()).unwrap();

    // We will use an AtomicI64 to communicate a user-defined metric ("progress") to the probe.
    let progress = probe.register_i64("progress".to_string())?;

    // Starts the probe (1sec is a lot. The heartbeat can be realistically set as low as a few millis).
    probe.spawn_heartbeat(std::time::Duration::from_millis(1000))?;

    // do some stuff, update progress
    progress.store(percent_done, std::sync::atomic::Ordering::Relaxed);

    // do more stuff, log an event
    probe.log_event("about to get crazy")?;

    // still more stuff, and another event
    probe.log_event("done")?;
    Ok(())
}
Graph
- Install the command line tool.
cargo install readings
readings --help
Readings library plotter

USAGE:
    readings [FLAGS] [OPTIONS] <INPUT>

FLAGS:
        --single-core    Show CPU assuming single thread
    -h, --help           Prints help information
    -V, --version        Prints version information

OPTIONS:
    -f, --from <FROM>    Timestamp (seconds) or event label to start from
    -t, --to <TO>        Timestamp (secodns) or event label to stop at.

ARGS:
    <INPUT>    Sets the input file to plot
- run it
Run readings readings.out and open readings.out.png.
Example
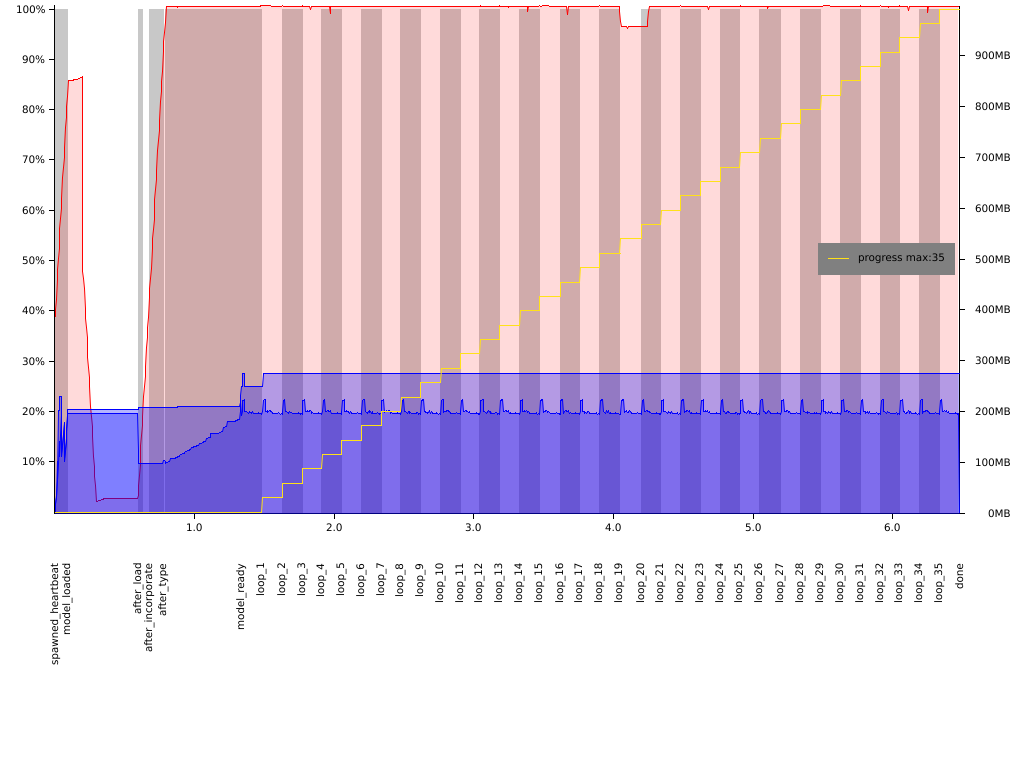
This is a incredibly beautiful example with tract loading a big neural network model and evaluating on a loop.
We know it does not exactly look beautiful... But this is 0.1! We will get better. In the meantime here are a few hints:
- red curve (and area) represent the CPU usage. Here 100% represents one single core
saturation (as we the ran the grapher with
--single-core). - both blue lines represent memory usage. The lower one is rust global allocator instrumentation, the higher one is the RSS as reported by the OS. You can notice how the global allocator probe is much more useful than the RSS one...
- the yellow staircase is a user-defined metric: in tract we defined one to count the loops over our neural network evaluation
- the background grey strips represent events: each time
log_eventis called, it switches between grey and white. The event label is written in the lower part. - memory graphs are obviously indexed by the right hand axis. All the rest is a percentage: %cpu, or % of the maximum value reached for a user-defined probe.
License
Apache 2.0/MIT
All original work licensed under either of
- Apache License, Version 2.0 (LICENSE-APACHE or http://www.apache.org/licenses/LICENSE-2.0)
- MIT license (LICENSE-MIT or http://opensource.org/licenses/MIT) at your option.
Contribution
Unless you explicitly state otherwise, any contribution intentionally submitted for inclusion in the work by you, as defined in the Apache-2.0 license, shall be dual licensed as above, without any additional terms or conditions.
Dependencies
~3–5MB
~83K SLoC