13 releases
| 0.2.4 | Aug 16, 2024 |
|---|---|
| 0.2.3 | Apr 12, 2024 |
| 0.2.2 | Mar 18, 2024 |
| 0.2.1 | Feb 24, 2024 |
| 0.0.8 | Jul 24, 2023 |
#1535 in Command line utilities
405KB
2.5K
SLoC
pumas
![]()
![]()
![]()
![]()
![]()
A nvtop-inspired command line tool for Apple Silicon Macs: aka M1, M2, ... This is basically a reimplemented version of asitop in Rust.
| Type | Metrics | Available | Comments |
|---|---|---|---|
| Utilization | CPU Clusters, GPU, ANE | ✓ | History & current values. ANE util. is measured via power |
| Power | CPU, GPU, ANE, total package | ✓ | History & current values |
| Frequency | CPU Clusters, GPU | ✓ | Current avg. values |
| Frequency | CPU Clusters, GPU | planned | Residency distrib. histograms |
| Memory | RAM & Swap: size and usage | ✓ | Apple removed memory bandwidth from powermetrics. |
To gather data, Pumas uses both the macOS built-in powermetrics utility, and the sysinfo
crate (same data as htop).
The built-in powermetrics allows access to a variety of hardware performance counters. Note
that Pumas requires sudo to run only due to powermetrics needing root access to run.
Pumas is lightweight and has minimal performance impact.
Installation
brew install graelo/tap/pumas
or
cargo install pumas
Quickstart
sudo pumas run
Use the arrow keys to switch between tabs. Press Esc, q or x to quit.
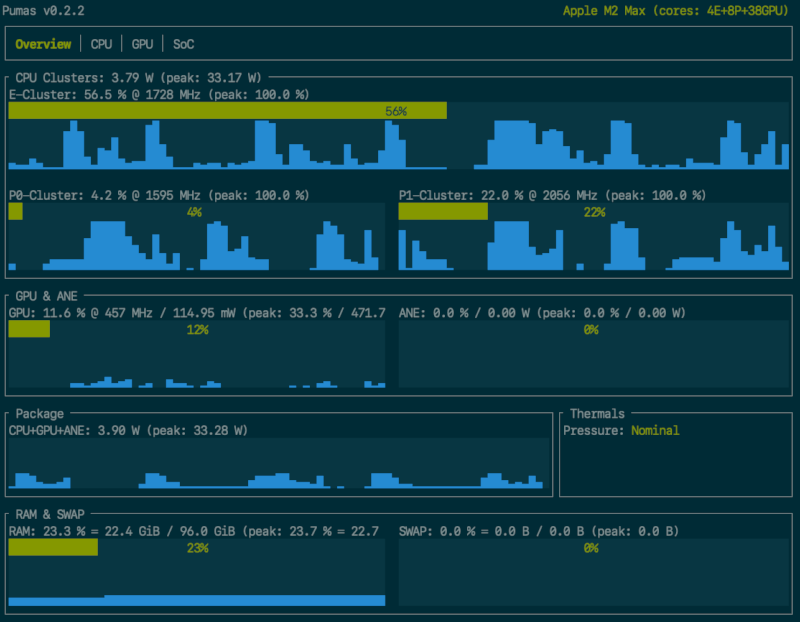
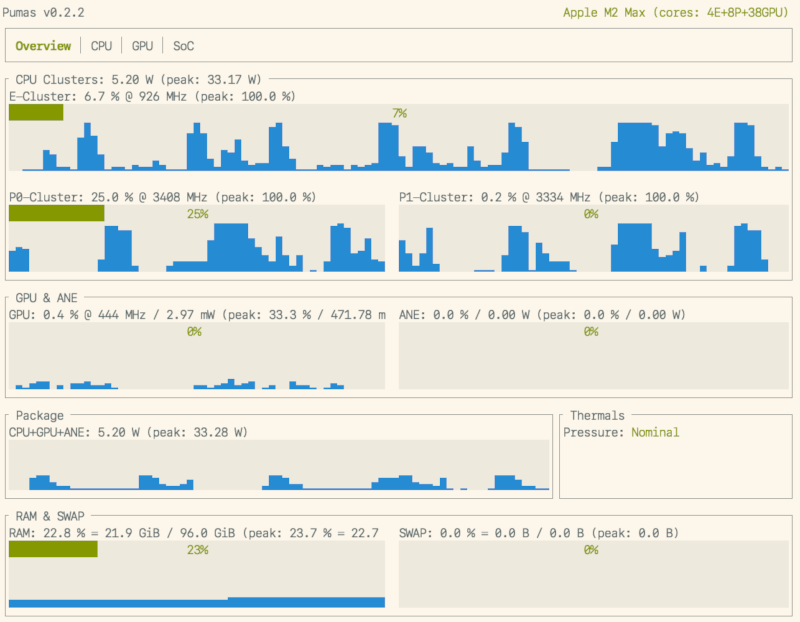
Screenshots
Overview Tab: global metrics for utilization and power consumption.
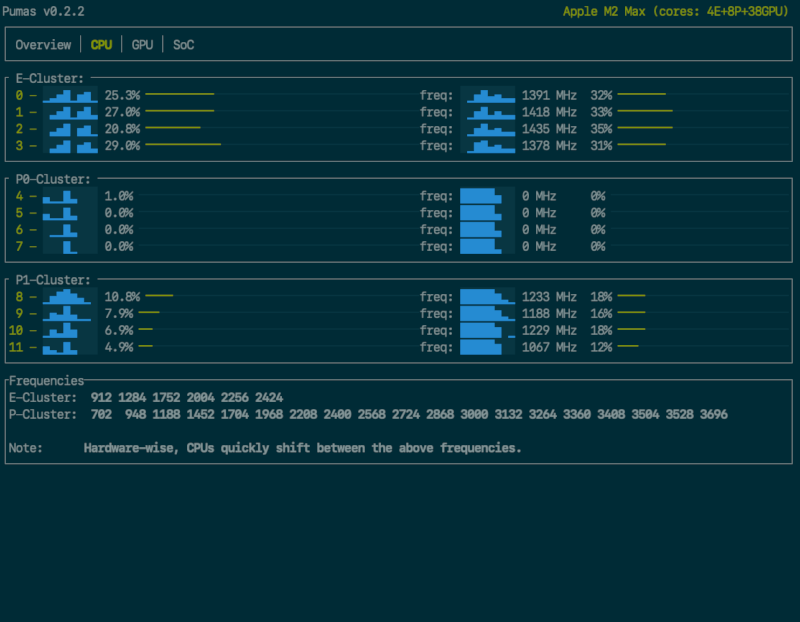
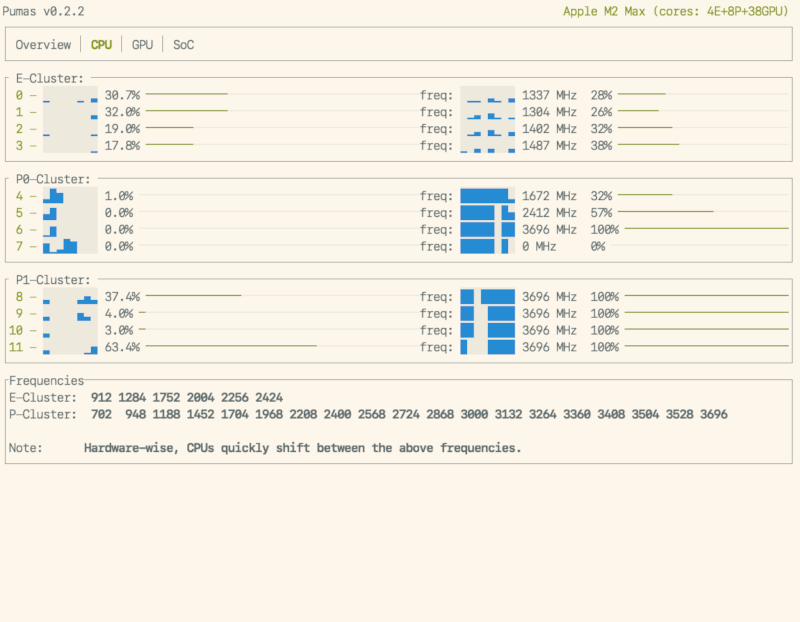
CPU Tab: per-cluster CPU utilization (with short history) and frequency (with short history)
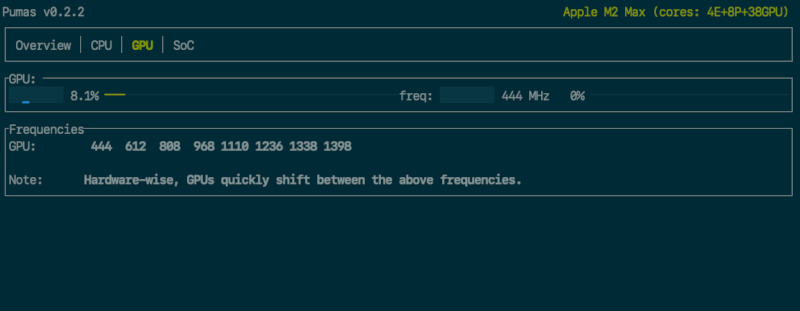
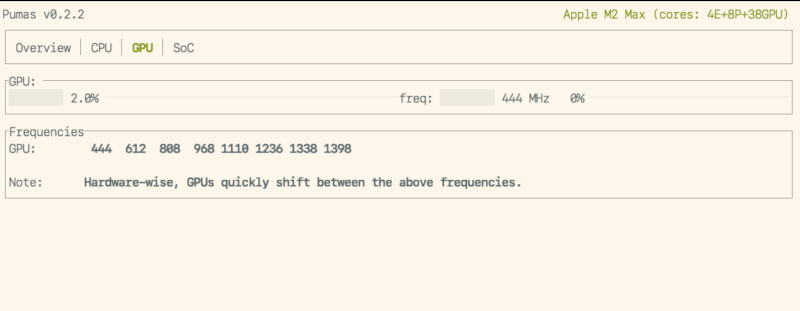
GPU Tab: GPU utilization (with short history) and frequency (with short history)
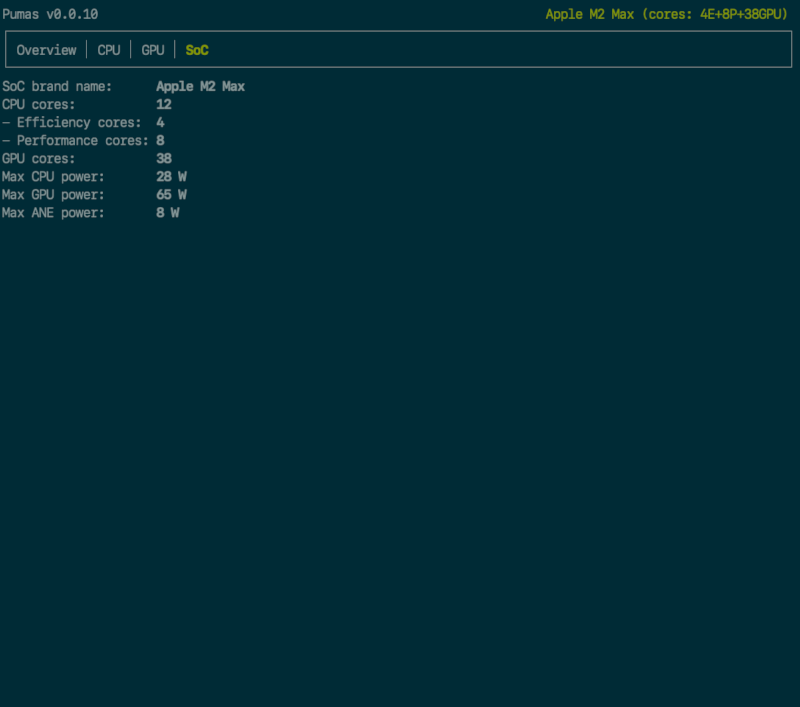
SoC Tab: misc info about the SoC
Startup:
Usage
$ pumas --help
A power usage monitor for Apple Silicon.

Usage: pumas <COMMAND>

Commands:
  run                  Run the power usage monitor
  generate-completion  Print a shell completion script to stdout
  help                 Print this message or the help of the given subcommand(s)

Options:
  -h, --help     Print help
  -V, --version  Print version
Pumas can run in two modes: UI mode (the default) and JSON mode.
$ pumas run --help
Run the power usage monitor

Usage: pumas run [OPTIONS]

Options:
  -i, --sample-rate <SAMPLE_RATE_MS>
          Update rate (milliseconds): min: 100 [default: 1000]
      --history-size <HISTORY_SIZE>
          History buffer size: default: 128 [default: 128]
      --accent-color <ACCENT_COLOR>
          Accent color for labels: ASCII code in 0~255, default: green [default: 2]
      --gauge-fg-color <GAUGE_FG_COLOR>
          Gauge foreground color: ASCII code in 0~255, default: green [default: 2]
      --gauge-bg-color <GAUGE_BG_COLOR>
          Gauge background color: ASCII code in 0~255, default: white [default: 7]
      --history-fg-color <HISTORY_FG_COLOR>
          History foreground color: ASCII code in 0~255, default: blue [default: 4]
      --history-bg-color <HISTORY_BG_COLOR>
          History background color: ASCII code in 0~255, default: white [default: 7]
      --json
          Print metrics to stdout as JSON instead of running the UI
  -h, --help
          Print help (see more with '--help')
  -V, --version
          Print version
JSON Mode
In JSON mode, Pumas will stream metrics to stdout as JSON instead of running the UI. You can
then pipe the metrics to jq, or create a node-exporter for Prometheus, etc.
For instance, the following command will stream the active ratio of the third CPU core of the first CPU cluster at each sample interval:
$ sudo pumas run --json | jq '.metrics.e_clusters[0].cpus[2].active_ratio'
0.04624276980757713
0.11764705926179886
^C
The JSON schema and an example are available in the schema directory.
Source of metrics
sysinfo crate is used to measure the following:
- per-cluster CPU utilization
- per-core CPU utilization
- RAM & Swap usage & size
powermetrics is used to measure the following:
CPU usage via(removed: incorrect on M2 chips)powermetrics- GPU utilization via active residency
- CPU & GPU frequency
- Package/CPU/GPU/ANE energy consumption
sysctl is used to measure the following:
- CPU name
- CPU core counts
system_profiler is used to measure the following:
- GPU core count
Some information is guesstimate and hardcoded as there doesn't seem to be a official source for it on the system:
- CPU, GPU & ANE max power draw
License
Licensed under the MIT License.
Contribution
Unless you explicitly state otherwise, any contribution intentionally submitted for inclusion in the work by you, as defined in the MIT license, shall be licensed as MIT, without any additional terms or conditions.
Dependencies
~11MB
~191K SLoC