7 releases (stable)
| 2.0.0 | Dec 24, 2024 |
|---|---|
| 1.0.4 | Jun 29, 2024 |
| 1.0.2 | Feb 29, 2024 |
| 0.1.0 | Feb 11, 2024 |
#176 in Compression
391 downloads per month
66KB
973 lines
prs-rs
About
Rust port of the SEGA PRS Compression scheme.
You can learn more about this project in the dedicated documentation page.
Development
How to develop this project.
Clone this Repository:
# When cloning, make sure symlinks are enabled
git clone -c core.symlinks=true https://github.com/Sewer56/prs-rs.git
Install Rust:
- Install the Rust Toolchain.
Setup IDE:
- This repository is fully with VSCode. Guidance below.
Visual Studio Code Integration
Code/VSCode is the de-facto Rust development environment.
The following extensions are required:
- rust-analyzer for Rust support.
- coverage-gutters for Coverage support.
- CodeLLDB for debugging.
- crates easier dependency management.
The VSCode configuration in Reloaded projects (.vscode) contain the following:
- Run Rust linter
clippyon Save. - Run code format
rustfmton Save. - Tasks for common operations (generate documentation, active CI/CD etc.).
These configurations are in the .vscode folder; and the tasks can be ran via Ctrl+Shift+P -> Run Task.
Test Coverage
First install or update tarpaulin:
cargo install cargo-tarpaulin
To run Coverage, run task (Ctrl+Shift+P -> Run Task), you should see something similar to:
| Task | Description |
|---|---|
| Cargo Watch Tarpaulin | Automatically runs tests and updates coverage on save. |
| Generate Code Coverage | Manually generate code coverage (cobertura.xml, tarpaulin-report.html) |
The tarpaulin-report.html file can be opened in VSCode (Show Preview) for a live view.
For GUI integration, run action Coverage Gutter: Watch (in Ctrl+Shift+P actions menu).
Debugging Benchmarks
If you wish to debug benchmarks in VSCode, go to Run and Debug Menu and generate the launch
profiles, you should get one for debugging benchmarks.
Profiling Benchmarks
Linux/OSX
Execute the following:
cargo bench --bench my_benchmark --profile profile -- --profile-time 10
This should give you a flamegraph in target/criterion/<method_name>/profile. You can open that flamegraph in a web browser.
Windows
Execute the following:
cargo bench --bench my_benchmark --no-run --profile profile
Navigate to the executable listed in the commandline:
target/profile/deps/my_benchmark-eced832ac8f31257.exe
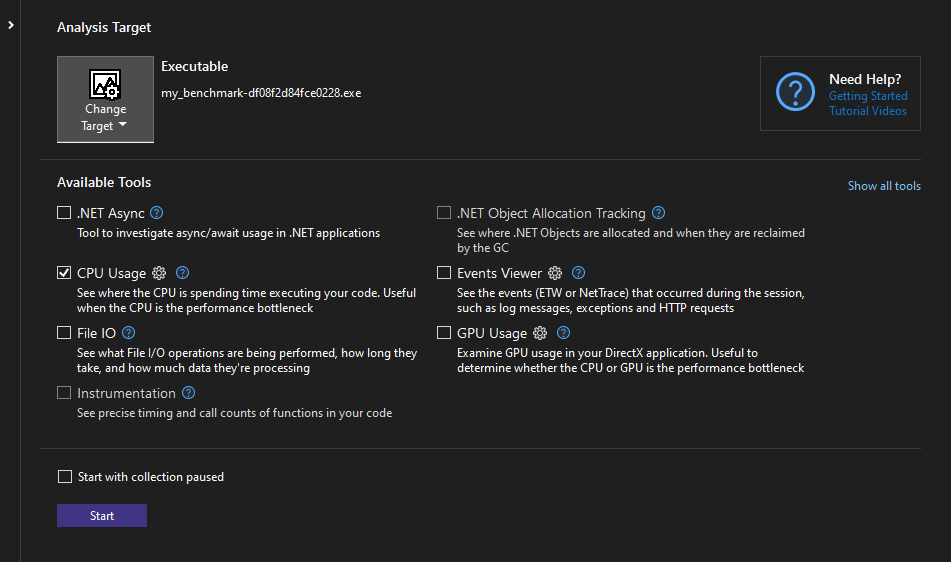
And run with command my_benchmark-eced832ac8f31257.exe --bench --profile-time 10 under an external profiler, such as Visual Studio.

Optimizing for Size when Creating C Libraries
- Add
"cdylib"crate type toCargo.toml(if not already present)
[lib]
crate-type = ["cdylib"]
Install cargo-bloat, nightly toolchain and build-std:
cargo install cargo-bloat
rustup toolchain install nightly
rustup component add rust-src --toolchain nightly
Run cargo-bloat the following command to calculate package size:
RUSTFLAGS="-C panic=abort -C lto=fat -C embed-bitcode=yes" cargo +nightly bloat -Z build-std=std,panic_abort -Z build-std-features=panic_immediate_abort --target x86_64-pc-windows-gnu --profile profile --crate-type cdylib -n 100 --features c-exports
Change --target if needed for your platform.
This should produce binaries more appropriate for dynamic linking from C.
PGO (Profile Guided Optimization) on C Libraries
This Reloaded-based library is built with Profile Guided Optimization (PGO).
PGO is a compiler optimization technique that uses data from profiling runs to improve the quality of the generated code.
Details of the PGO implementation in this project are as follows:
- We collect PGO data by running the
benchmarkswith thepgofeature enabled. - This is done in CI, before building the final C library.
You should ensure that only realistic representative workloads are used to collect the PGO data.
For example, if this was a compression library, you should run the 'compress' and 'decompress' methods on real files (not random data) as part of your benchmarks.
Non-realistic/representative workloads in benchmarks should be excluded through the 'pgo' feature flag, for example an unrealistic benchmark can be excluded like this:
#[cfg(not(feature = "pgo"))]
{
    bench_create_dict(c);
}
Testing PGO
PGO isn't guaranteed to always provide an improvement, after adding representative workloads, always test.
We will test with cargo pgo.
First, install the following:
cargo install cargo-pgo
rustup toolchain install nightly
rustup component add llvm-tools-preview
Then run an 'instrumented' benchmark, this will run your code in pgo_benchmark and collect some data:
cargo +nightly pgo instrument bench
After that run a regular benchmark to create a 'baseline' number:
cargo +nightly bench
And run the PGO optimized build:
cargo +nightly pgo optimize bench
If most of the results are equal or show an improvement, PGO has helped. Otherwise disable PGO from the library by editing the rust.yml workflow.
File Layout
The following is the expected file layout for your project:
.vscode/
docs/
src/
Cargo.toml
mkdocs.yml
The docs folder, and mkdocs.yml contain MkDocs Material documentation for your project.
The src folder should contains all source code for your project.
Cargo.toml should be in the root of the project.
C# Bindings for prs_rs
This Reloaded-based project provides C# bindings, as prs_rs.Net.Sys.
These are the raw bindings to the C exports of this Rust library, and are automatically generated.
The project is inside bindings/csharp folder.
It shouldn't be modified.
Instead, if you want to make a 'friendlier' API, make a separate project with prs_rs.Net.Sys as a dependency, and provide high level bindings.
Contributing
See CONTRIBUTING for guidance on how to contribute to this project.
License
Licensed under GPL v3 (with Reloaded FAQ).
Learn more about Reloaded's general choice of licensing for projects..
No runtime deps
~0–390KB