6 releases
| 0.4.1 | Nov 18, 2022 |
|---|---|
| 0.4.0 | Oct 20, 2022 |
| 0.3.1 | Sep 9, 2022 |
| 0.2.1 | Sep 2, 2022 |
| 0.1.0 |
|
#428 in Visualization
30 downloads per month
235KB
3K
SLoC
plt
![]()
![]()
A plotting library with a focus on publication level aesthetics and ergonomic control.
Structure
- Plots are drawn on a
Subplot. - One or more subplots are organized in a
Layout. - The layout is added to a
Figure, which is used to draw to a file or directly to aBackend.
Use
To get started, see the examples directory in the main repository.
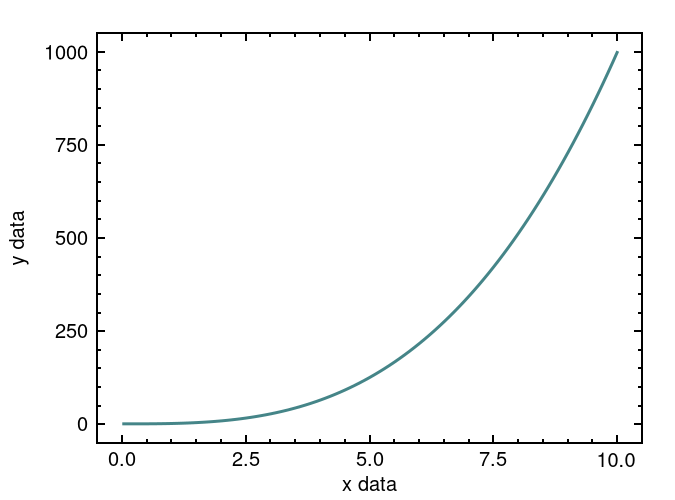
Example
use plt::*;

// create data
let xs: Vec<f64> = (0..=100).map(|n: u32| n as f64 * 0.1).collect();
let ys: Vec<f64> = xs.iter().map(|x| x.powi(3)).collect();

// create subplot
let mut sp = Subplot::builder()
    .label(Axes::X, "x data")
    .label(Axes::Y, "y data")
    .build();

// plot data
sp.plot(&xs, &ys).unwrap();

// make figure and add subplot
let mut fig = <Figure>::default();
fig.set_layout(SingleLayout::new(sp)).unwrap();

// save figure to file
fig.draw_file(FileFormat::Png, "example.png").unwrap();
Dependencies
Currently, the only implemented backend depends on Cairo.
Debian / Ubuntu
apt install libcairo2-dev
Arch
pacman -Syu cairo
Dependencies
~1.6–2.5MB
~50K SLoC