4 releases
| 0.1.3 | Aug 22, 2023 |
|---|---|
| 0.1.2 | Aug 21, 2023 |
| 0.1.1 | Jul 15, 2022 |
| 0.1.0 | Jul 13, 2022 |
#6 in #gnuplot
25 downloads per month
90KB
207 lines
plotcap
Introduction
plotcap is a small command line utility for plotting the packet and data
rates of the network traffic in a PCAP file.
It aggregates three measurements at regular intervals (default of 1s, but
adjustable via the -i argument) seconds:
- Packet count
- Bytes on the wire
- Bytes captured (different from the wire size if snaplen is less than the packet size)
plotcap then writes an executable gnuplot script
that embeds the data for the above measurements and plots them on two Y axis
(left for packets per second, right for Bytes per second) with relative time on
the X axis.
Because the output file can be relatively small, you can easily copy it off the
system where plotcap is executed (a handy trick in constrained environments,
especially with a statically linked binary - see the section below) and then
execute the script on your laptop (or any GUI system with gnuplot installed)
for visualisation.
Note that the output script runs gnuplot in persistent mode (-p) and uses
pause mouse close to allow interaction with the plot. This is useful for
zooming into areas (try right-click and drag).
Building
To install the latest version of plotcap, ensure you have a Rust toolchain
installed, then run:
cargo install plotcap
Or, to build from source (binary in target/release/plotcap):
cargo build --release
To build a statically linked version of plotcap, you need the Rust MUSL
toolchain, which you can install with:
rustup target add x86_64-unknown-linux-musl
...after which you can build it with:
cargo build --target=x86_64-unknown-linux-musl --release
The resulting static binary is located at target/x86_64-unknown-linux-musl/release/plotcap.
Usage
plotcap --help
plotcap 0.1.3
Simeon Miteff <simeon.miteff@corelight.com>
Plot packet and data rates over time given a PCAP file, with gnuplot.

USAGE:
    plotcap [OPTIONS] --read <FILE> --output <FILE>

OPTIONS:
    -h, --help                   Print help information
    -i, --interval <INTERVAL>    [default: "1 second"]
    -o, --output <FILE>
    -r, --read <FILE>
    -V, --version                Print version information
Examples
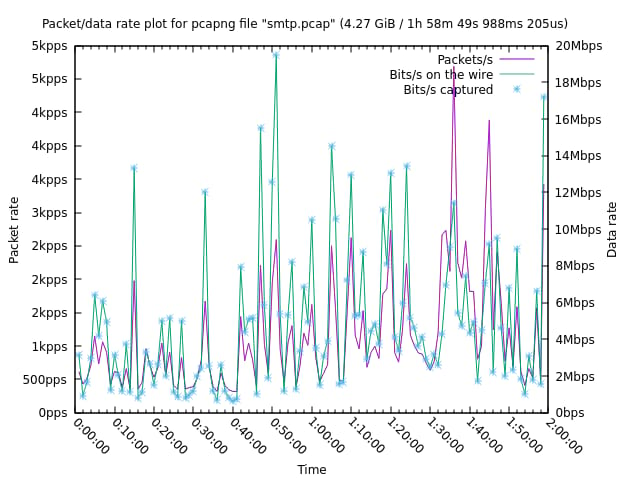
smtp.pcap is a ~2h, ~4.3GB file with 8 million packets in it. To reduce the
number of plot points we increase the aggregation to 60s with -i 60s:
plotcap -r smtp.pcap -i 60s -o smtp-60s.plg
The resulting smtp-60s.plg is 142 lines (5.4KB). Running the script produces:
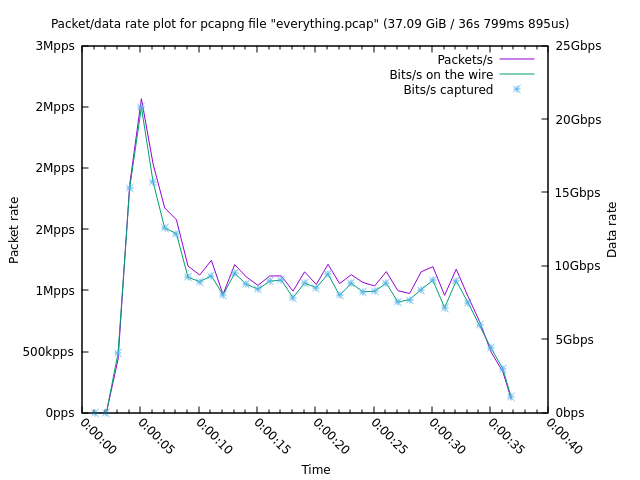
everything.pcap is a ~37s, ~38GB file with 37 million packets in it. We run
plotcap with the default aggregation interval:
plotcap -r everything.pcap -o everything.plg
The output file is 60 lines (2.5KB). Running it produces:
Dependencies
~3.5–4.5MB
~84K SLoC