16 releases
| 0.3.3 | Jan 16, 2025 |
|---|---|
| 0.3.2 | Jan 16, 2025 |
| 0.2.1 | Dec 25, 2023 |
| 0.1.11 | Dec 21, 2023 |
#211 in Filesystem
883 downloads per month
725KB
590 lines
Process Monitor in Rust

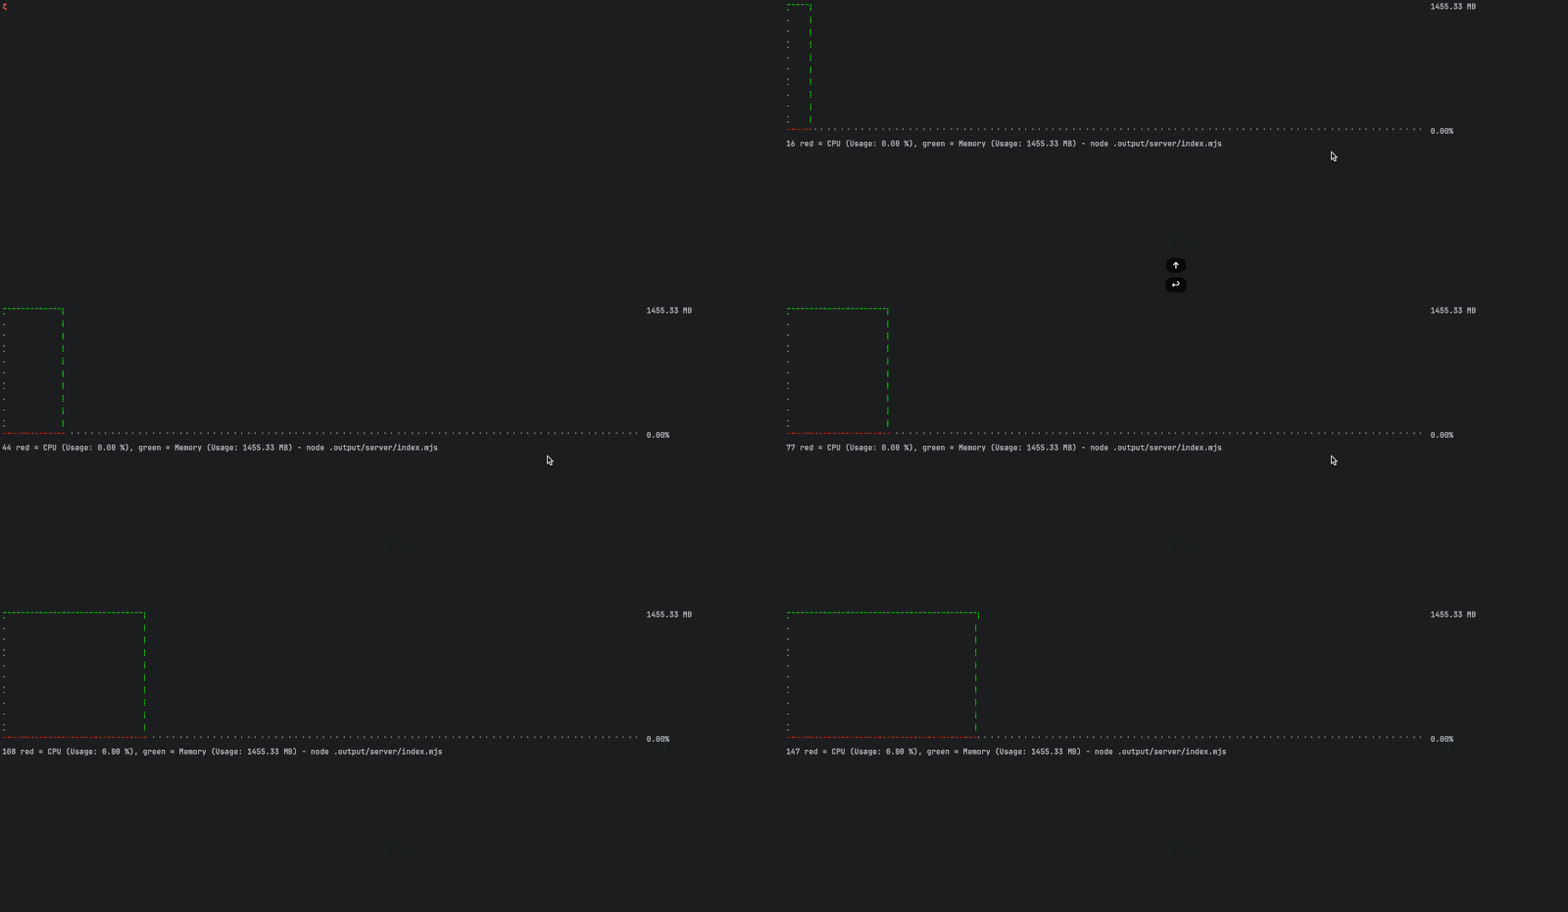
This Rust application provides a simple interface to monitor CPU and memory usage of processes running on your system. It allows users to filter and select a process from the list and displays real-time CPU and memory usage using colored graphs.
Features
- Process Filtering: Filter processes by name.
- Interactive Selection: Choose a process to monitor from a filtered list.
- Real-time Monitoring: View real-time CPU and memory usage of the selected process.
- Graphical Display: CPU and memory usage are displayed as colored lines on a graph.
Requirements
- Rust programming environment.
- Dependencies:
sysinfo,dialoguer,rgb,textplots.
Installation
- Clone the repository:
git clone https://github.com/s00d/monit-tool - Navigate to the directory:
cd ./monit-tool - Build the project:
cargo build --release
crates.io
Before installing the monit-tool package, you need to install Rust. Rust is a programming language that the package is built with. Here are the steps to install Rust:
-
Open a terminal or command prompt.
-
Visit the official Rust website at https://www.rust-lang.org/.
-
Follow the instructions on the website to download and install Rust for your operating system.
-
After the installation is complete, verify that Rust is installed correctly by running the following command in your terminal:
rustc --version
You can install the monit-tool package using the cargo utility. Make sure you have Rust compiler and cargo tool installed.
-
Open a terminal or command prompt.
-
Run the following command to install the package:
cargo install monit-tool
Usage
- Run the program:
monit-tool - Enter a filter to search for a specific process or leave it blank to list all processes.
- Select a process from the list to monitor.
- The program will display real-time CPU and memory usage on a graphical chart.
Command-Line Parameters
The monit-tool application accepts the following command-line parameters:
--nameor-n: (Optional) Filter processes by their name. If you provide a name, the application will display only those processes whose names contain the specified string. For example,monit-tool --name firefoxwill display processes related to Firefox. If you do not specify this parameter, the application will list all running processes.--commandor-c: (Optional) Execute and monitor a specific command. If provided, the application will start the specified command and monitor its CPU and memory usage. For example,monit-tool --command "python3 script.py"will start and monitor the Python script.--workdir: (Optional) Set the working directory for the command specified with--command. Defaults to the current directory (.). For example,monit-tool --command "python3 script.py" --workdir "/path/to/script"will run the script in the specified directory.--watchor-w: (Optional) Enables continuous monitoring of the selected process. If the selected process terminates and then restarts, the application will automatically continue monitoring the new instance of this process. This is particularly useful for tracking processes that may restart during observation.--loggingor-l: (Optional) Enables logging of monitoring data to a log file. If this option is enabled, the application will create a log file with a timestamped name to record the monitoring data. The log file will include CPU usage, memory usage, and, if enabled, disk write and disk read information for the selected process.--disk-write: (Optional) Enables monitoring and display of disk write activity for the selected process. If this option is enabled, the application will include information about disk write usage in the monitoring chart.--disk-read: (Optional) Enables monitoring and display of disk read activity for the selected process. If this option is enabled, the application will include information about disk read usage in the monitoring chart.--nochart: (Optional) Disables the chart output. If this option is enabled, the application will only log the data (if logging is enabled) without displaying the graphical chart.--sleep: (Optional) Sets the refresh interval (in milliseconds) for updating the monitoring data. Defaults to 50 milliseconds. For example,monit-tool --sleep 100will refresh the data every 100 milliseconds.
Example Usage with Parameters
monit-tool --name nginx --watch --logging --disk-write --disk-read
This command filters the process list for 'nginx', enables continuous monitoring, logs the data to a file, and includes disk write and read activity in the monitoring chart.
Additional Notes
- If both
--nameand--commandare provided, the application will prioritize the--commandand start the specified process for monitoring. - The
--watchparameter is particularly useful when monitoring services or processes that may restart frequently. - The
--loggingparameter is useful for long-term monitoring and analysis of process behavior. - The
--disk-writeand--disk-readparameters provide additional insights into the I/O activity of the monitored process.
Customization
- Modify the graph dimensions or the refresh rate in the main loop for different display preferences.
Contributing
Contributions, issues, and feature requests are welcome. Feel free to check issues page if you want to contribute.
License
Distributed under the MIT License. See LICENSE for more information.
Acknowledgements
Dependencies
~10–20MB
~293K SLoC