1 unstable release
| 0.21.0 |
|
|---|---|
| 0.20.1 | Feb 12, 2024 |
#263 in Profiling
11KB
86 lines
Walking on water with this profiler for RISC Zero

This repo presents a plugin for RISC Zero programs that counts the number of cycles contributing by different parts of the program, detects execution steps that lead to significant number of cycles, and explains the underlying reasons.
Developers can add start_timer!, stop_start_timer!, and stop_timer! in the program to trace where the cycles come from. An example
is as follows.
start_timer!("Load data");
......

    start_timer!("Read from the host");
    ......

    stop_start_timer!("Check the length");
    ......

    stop_start_timer!("Hash");
    ......

    stop_timer!();

stop_timer!();
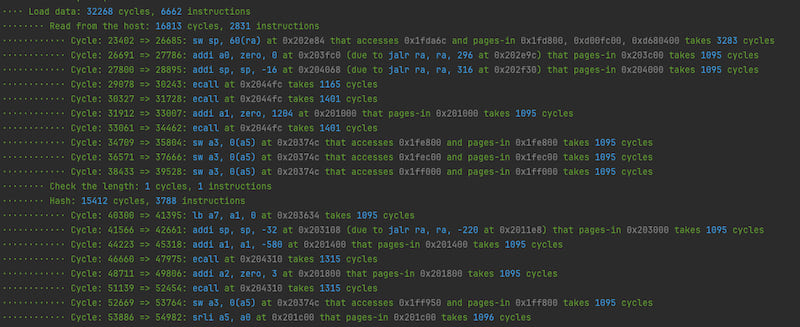
The profiler will output colorized information about the breakdown of the cycles. Specifically, if the profiler sees a single execution step that, however, leads to a large number of cycles, it would call it out and find out the underlying reasons.
One may ask why we say this profiler is "walking on water". This is because, unlike prior solutions based on eprintln!, the profiler itself tries
very hard not to affect the original execution, in particular the cycle count, of the program.
How to use?
There are necessary changes that need to be made on the RISC Zero program's host and guest.
Host
The host should use the host crate l2r0-profiler-host and use ExecutorEnv to run the program.
let cycle_tracer = Rc::new(RefCell::new(CycleTracer::default()));

let env = ExecutorEnv::builder()
        .write_slice(&task.a)
        .write_slice(&task.b)
        .write_slice(&task.long_form_c)
        .write_slice(&task.k)
        .write_slice(&task.long_form_kn)
        .trace_callback(|e| {
            cycle_tracer.borrow_mut().handle_event(e);
            Ok(())
        })
        .build()
        .unwrap();

let mut exec = ExecutorImpl::from_elf(env, METHOD_ELF).unwrap();
let _ = exec.run().unwrap();

cycle_tracer.borrow().print();
In the example above, we first create the cycle tracer.
let cycle_tracer = Rc::new(RefCell::new(CycleTracer::default()));
Then, we use trace_callback to ask ExecutorEnv to send back execution trace to the profiler.
.trace_callback(|e| {
    cycle_tracer.borrow_mut().handle_event(e);
    Ok(())
})
After the execution is done, ask the cycle tracer to output the profiling results.
cycle_tracer.borrow().print();
Guest
Guest also has its own crate, l2r0-profiler-guest. Import it, and remember to turn on the print-trace feature.
When the program starts, as shown below.
fn main() {
    l2r0_profiler_guest::init_trace_logger();
    start_timer!("Total");
    ......
    stop_timer!();
}
We first initialize the trace logger.
l2r0_profiler_guest::init_trace_logger();
Then, the guest can use the macros to break down the program into smaller pieces for examination.
How does it work?
The way that the profiler works is similar to a hardware watchpoint.
When the guest program starts, the guest-side cycle tracer---uses some dummy instructions (writing to the zero register)---to notify the host-side cycle tracer about the buffers to be watched. The code is here.
#[inline(always)]
pub fn init_trace_logger() {
    unsafe {
        core::arch::asm!(
            r#"
            nop
            li x0, 0xCDCDCDCD
            la x0, TRACE_MSG_CHANNEL
            la x0, TRACE_MSG_LEN_CHANNEL
            la x0, TRACE_SIGNAL_CHANNEL
            nop
        "#
        );
    }
}
The host-side cycle tracer will then watch over these three channels. If the program writes data to these memory locations, the host-side cycle tracer can catch these changes and get the information in the channels.
For example,
start_timer!(msg)copies the messagemsgintoTRACE_MSG_CHANNELand writes the message length intoTRACE_MSG_LEN_CHANNEL, which triggers the host-side cycle tracer to mark that a new timer has started.end_timer!()writes a zero intoTRACE_SIGNAL_CHANNEL, which triggers the host-side cycle tracer to mark that the previous timer has stopped.
Both timers are designed to be minimalistic, in that we want them not to incur too many cycles. This is a significant improvement from previous approach that uses
eprintln!("{}", env::get_cycle_count()); in the guest, which would by itself create a lot of cycles and affect the calculation.
Limitations
Note that a profiler only sees memory writes, but not memory reads. Therefore, although the cycle count is correct, the profiler can only explain a fraction of the significant instructions on where the cycle comes from. More specifically,
- if an instruction makes a clean page dirty, the profiler can explain which page is made dirty.
- if an instruction loads a new page, the profiler cannot explain which page is being loaded by this instruction.
- if an instruction loads a new page and immediately makes it dirty (this is the case of allocating from the heap), the profiler can explain the cycles related to the page being dirty, but not the cycles related to the pages being loaded for the first time.
Another limitation is that all the cycles that occur when a new segment starts would be counted toward the first instruction immediately after it. These instructions would have an enormous number of cycle, for the following reasons.
-
If the instruction was originally planned to be put in the previous segment but there is insufficient space, the previous segment will be closed early with dummy cycles.
-
When the new segment starts, there are a number of cycles for pre-loading and post-loading.
-
Now that the new segment has no loaded pages, and no pages have been marked as dirty. This instruction can trigger many page operations. Assume that this instruction is a syscall for 256-bit modular reduction, in the worse case, each of
x,y,moduluscrosses two pages and does not overlap, andresalso crosses two pages that does not overlap, and the instruction for the syscall itself may appear in a new page. The 9 pages could even share only the root-level page table but none of 1st, 2nd, 3rd, 4th page tables---making sure thatx,y,modulus,rescrosses on very, very special locations. Note thatresmight have not been read before, and therefore it loads pages as well as marks those pages as dirty. This can already load 37 pages and mark 11 pages as dirty.
To avoid confusion, the profiler will highlight the first instruction in a new segment.
If you want to have a more precise analysis of paging, consider using GDB with the RISC-Zero-specific GDB stub:
https://github.com/l2iterative/gdb0
This GDB stub provides commands to query the current cycles, the number of loaded pages, and the number of dirty pages.
License
Please refer to LICENSE.