1 stable release
| new 47.0.1 | Apr 24, 2025 |
|---|
#166 in Debugging
295KB
947 lines
DataFusion Tracing
![]()
![]()
![]()
![]()
DataFusion Tracing is an extension for Apache DataFusion that helps you monitor and debug queries. It uses tracing and OpenTelemetry to gather DataFusion metrics, trace execution steps, and preview partial query results.
Note: This is not an official Apache Software Foundation release.
Overview
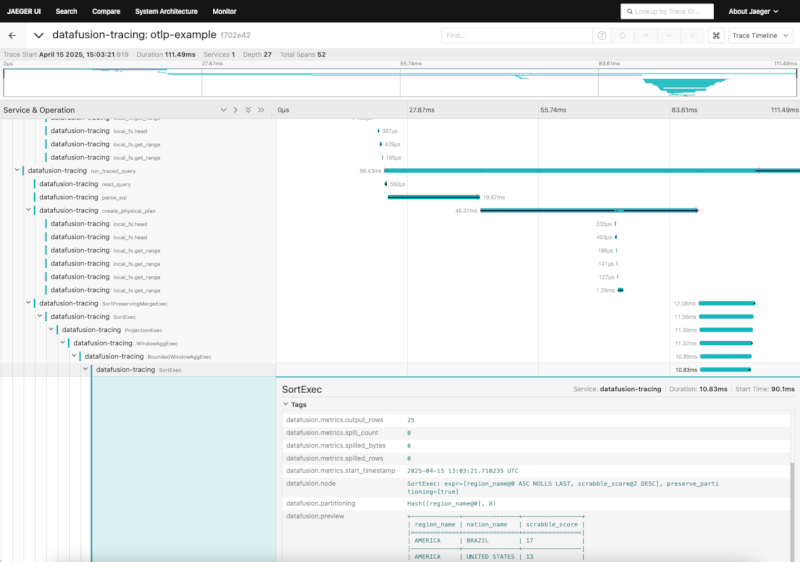
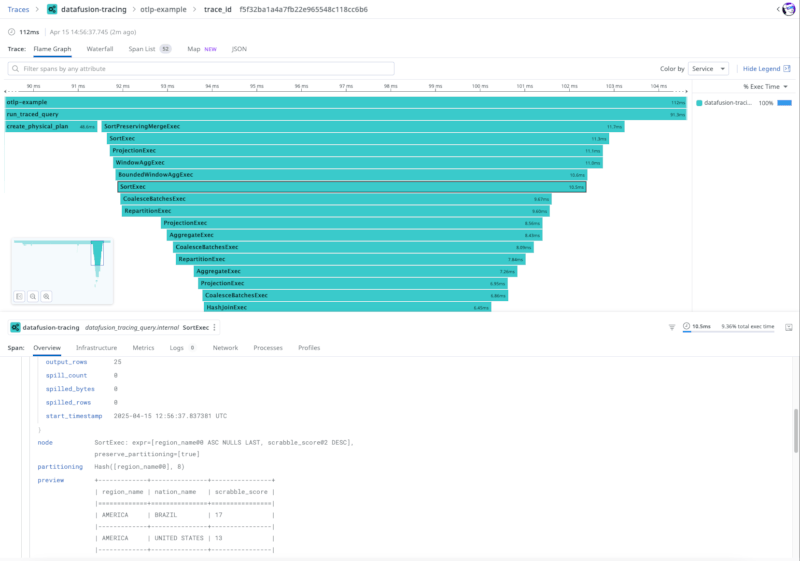
When you run queries with DataFusion Tracing enabled, it automatically adds tracing around execution steps, records all native DataFusion metrics such as execution time and output row count, lets you preview partial results for easier debugging, and integrates with OpenTelemetry for distributed tracing. This makes it simpler to understand and improve query performance.
See it in action
Here's what DataFusion Tracing can look like in practice:
Jaeger UI
DataDog UI
Getting Started
Installation
Include DataFusion Tracing in your project's Cargo.toml:
[dependencies]
datafusion = "47.0.0"
datafusion-tracing = "47.0.1"
Quick Start Example
use datafusion::{
    arrow::{array::RecordBatch, util::pretty::pretty_format_batches},
    error::Result,
    execution::SessionStateBuilder,
    prelude::*,
};
use datafusion_tracing::{
    instrument_with_info_spans, pretty_format_compact_batch, InstrumentationOptions,
};
use std::sync::Arc;
use tracing::field;

#[tokio::main]
async fn main() -> Result<()> {
    // Initialize tracing subscriber as usual
    // (See examples/otlp.rs for a complete example).

    // Set up tracing options (you can customize these).
    let options = InstrumentationOptions::builder()
        .record_metrics(true)
        .preview_limit(5)
        .preview_fn(Arc::new(|batch: &RecordBatch| {
            pretty_format_compact_batch(batch, 64, 3, 10).map(|fmt| fmt.to_string())
        }))
        .add_custom_field("env", "production")
        .add_custom_field("region", "us-west")
        .build();

    let instrument_rule = instrument_with_info_spans!(
        options: options,
        env = field::Empty,
        region = field::Empty,
    );

    let session_state = SessionStateBuilder::new()
        .with_default_features()
        .with_physical_optimizer_rule(instrument_rule)
        .build();

    let ctx = SessionContext::new_with_state(session_state);

    let results = ctx.sql("SELECT 1").await?.collect().await?;
    println!(
        "Query Results:\n{}",
        pretty_format_batches(results.as_slice())?
    );

    Ok(())
}
A more complete example can be found in the examples directory.
Setting Up a Collector
Before diving into DataFusion Tracing, you'll need to set up an OpenTelemetry collector to receive and process the tracing data. There are several options available:
Jaeger (Local Development)
For local development and testing, Jaeger is a great choice. It's an open-source distributed tracing system that's easy to set up. You can run it with Docker using:
docker run --rm --name jaeger \
  -p 16686:16686 \
  -p 4317:4317 \
  -p 4318:4318 \
  -p 5778:5778 \
  -p 9411:9411 \
  jaegertracing/jaeger:2.5.0
Once running, you can access the Jaeger UI at http://localhost:16686. For more details, check out their getting started guide.
DataDog (Cloud-Native)
For a cloud-native approach, DataDog offers a hosted solution for OpenTelemetry data. You can send your traces directly to their platform by configuring your DataDog API key and endpoint - their OpenTelemetry integration guide has all the details.
Other Collectors
Of course, you can use any OpenTelemetry-compatible collector. The official OpenTelemetry Collector is a good starting point if you want to build a custom setup.
Repository Structure
The repository is organized as follows:
datafusion-tracing/: Core tracing functionality for DataFusioninstrumented-object-store/: Object store instrumentationintegration-utils/: Integration utilities and helpers for examples and tests (not for production use)examples/: Example applications demonstrating the library usagetests/: Integration testsdocs/: Documentation, including logos and screenshots
Building and Testing
Use these commands to build and test:
cargo build --workspace
cargo test --workspace
Contributing
Contributions are welcome. Make sure your code passes all tests, follow existing formatting and coding styles, and include tests and documentation. See CONTRIBUTING.md for detailed guidelines.
License
Licensed under the Apache License, Version 2.0. See LICENSE.
Acknowledgments
This project includes software developed at Datadog (info@datadoghq.com).
Dependencies
~44–59MB
~1M SLoC