5 releases
| 0.1.4 | Nov 18, 2024 |
|---|---|
| 0.1.3 | Nov 15, 2024 |
| 0.1.2 | Nov 11, 2024 |
| 0.1.1 | Nov 8, 2024 |
| 0.1.0 | Nov 7, 2024 |
#274 in Encoding
390KB
690 lines
btetto
A tool that produces Perfetto protobuf from formatted bpftrace output.
Usage
$ sudo bpftrace my_script.bt -f json | btetto
Attached probes: 4
^C
Writing 149 events to trace file: bpftrace_trace.binpb
You can also pass a bpftrace output file to btetto e.g.
btetto my_bpftrace_output
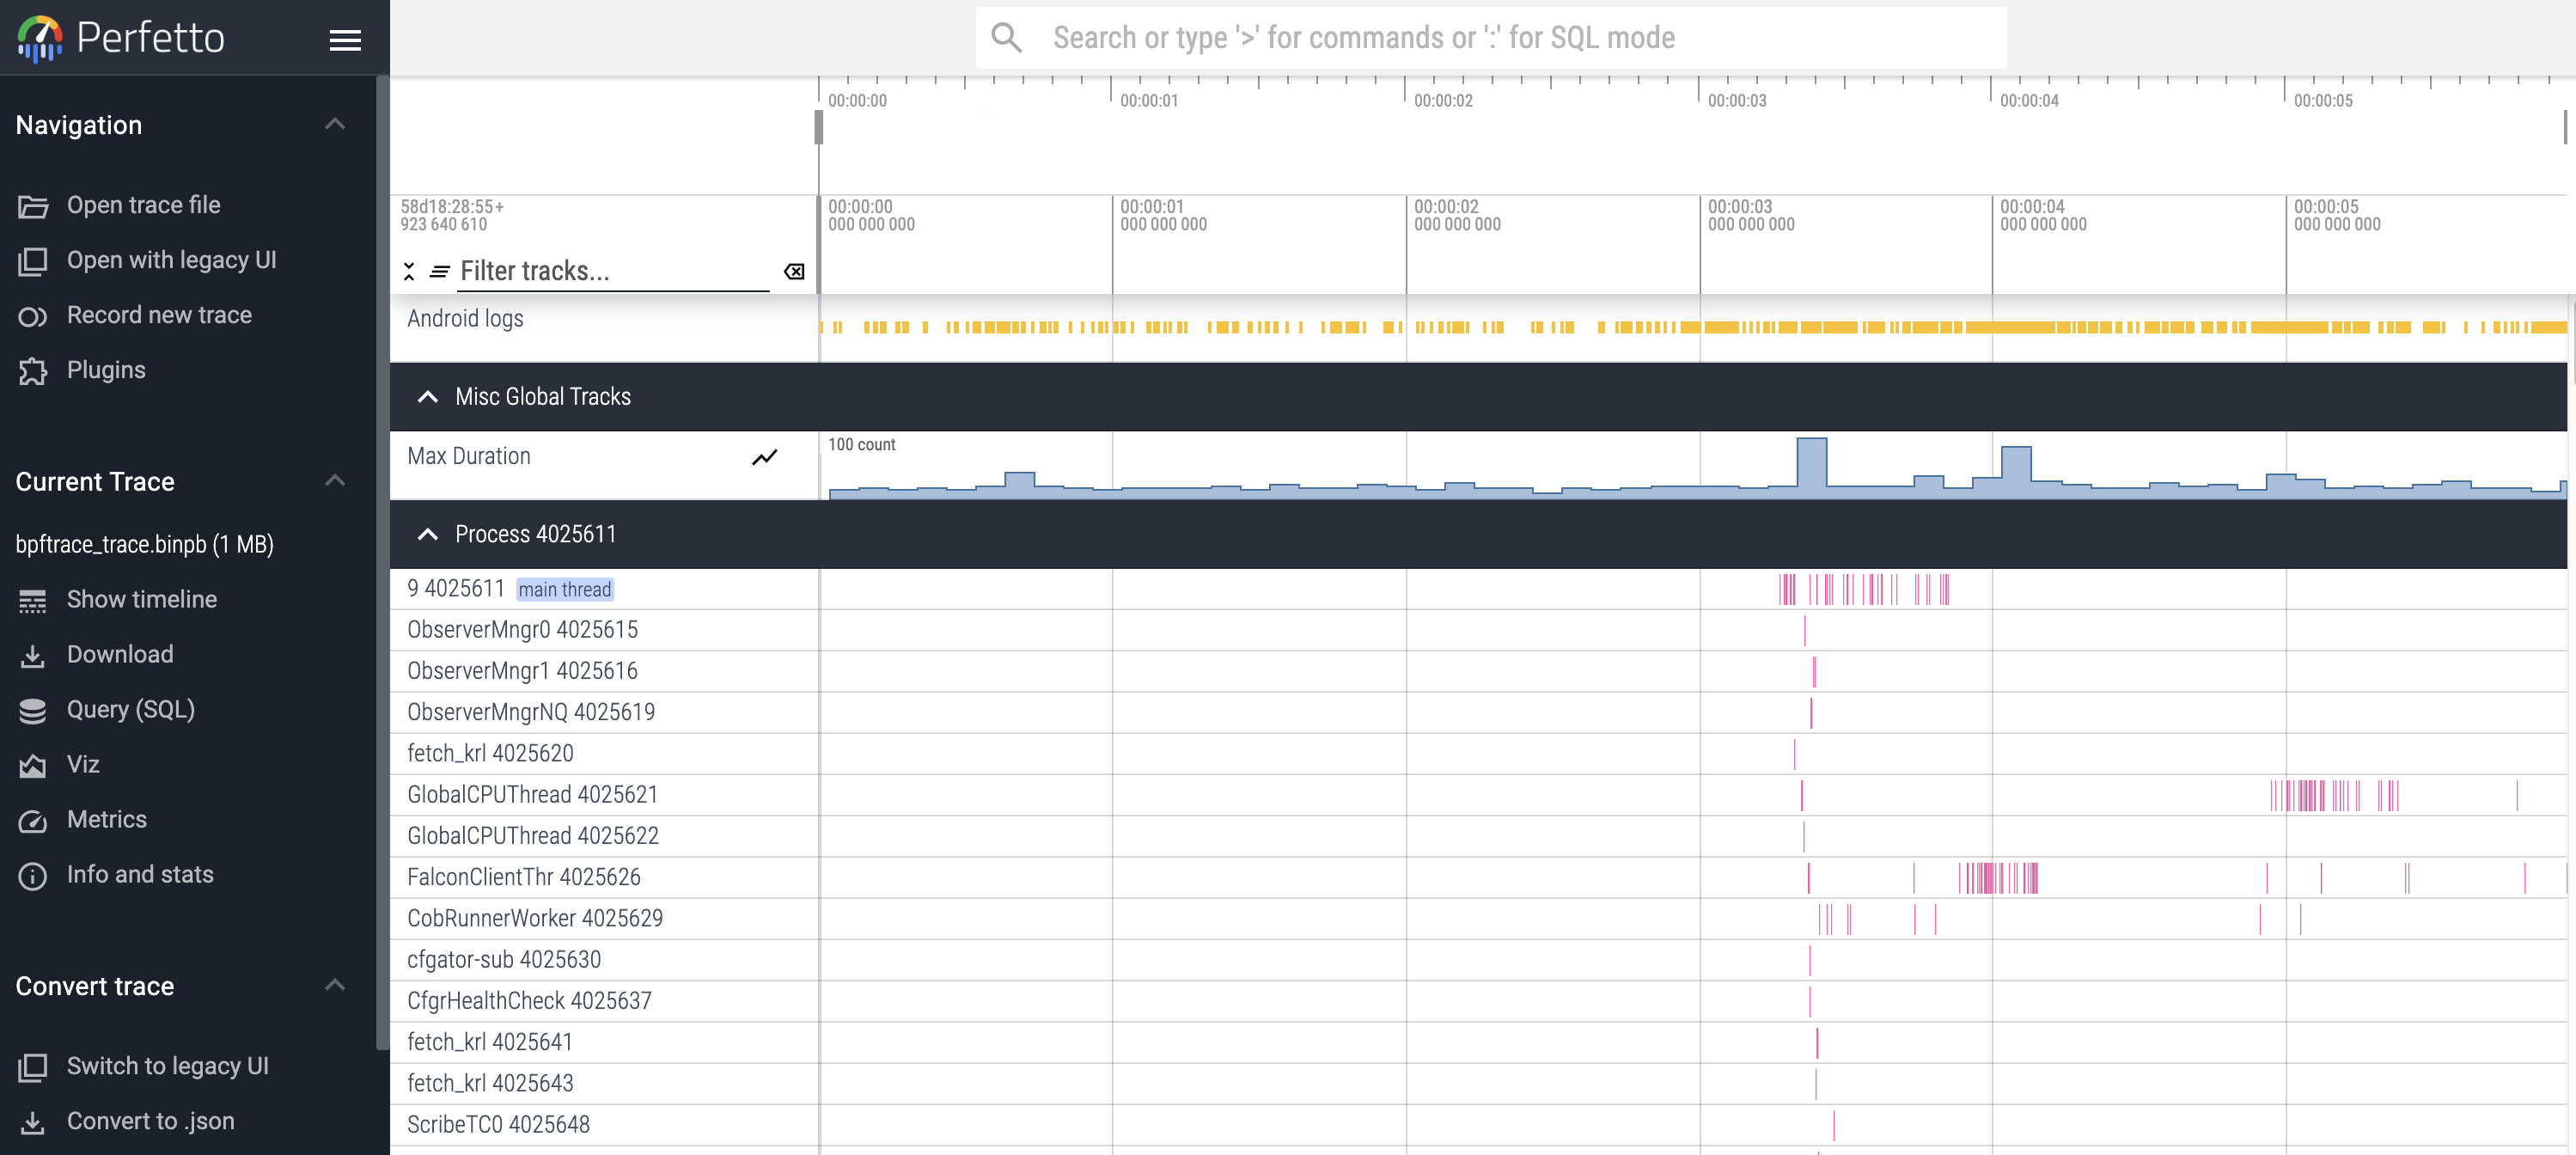
btetto.py produces a bpftrace_trace.binpb protobuf file, which can then be loaded into the Perfetto UI.
bpftrace Output Format
The print output from bpftrace should be tuples (in JSON format e.g. -f json) where the first item in the tuple is the event type and the rest of the items are key/value tuples.
Event Types
track_eventcall_stackstdout
Track Events (Spans)
Required Fields:
name(string)ts(timestamp)type(string - see below)
Optional Fields:
pid(number)thread_name(string)tid(number)track(string or number)track_parent(string or number)unit(string - see below)flow_id(string or number)log(tuple - see below)
Track Event Types
BEGINENDINSTANTCOUNTER
If the field is not listed above it will get logged as an annotation on the event like "bananas" and "greeting" below. pid, tid, and thread_name also get logged as annotations by default.
print(("track_event",
    ("name", "page_fault_user"),
    ("type", "BEGIN"),
    ("ts", $start),
    ("pid", pid),
    ("tid", tid),
    ("thread_name", comm),
    ("bananas", 10),
    ("greeting", "hello"),
    ("log", ("WARN", "this is my log message"))
));

print(("track_event",
    ("name", "page_fault_user"),
    ("type", "END"),
    ("ts", nsecs),
    ("pid", pid),
    ("tid", tid),
    ("thread_name", comm)
));
track and track_parent
These are used to name the "tracks" where these events exist. At the moment they can be nested one level, where you would provide both a track and a track_parent tuple (both strings).
If track is not provided, you must then provide pid, tid, and thread_name tuples and then these track events will go into global pid/tid "tracks".
unit
These are for COUNTER type track events and can be:
unspecifiedcount(default if no "unit" is provided)size_bytestime_ns
Example:
print(("track_event",
    ("name", "Max Duration"),
    ("type", "COUNTER"),
    ("ts", nsecs),
    ("track", "Max Duration"),
    ("unit", "count"),
    ("counter_value", @mx)
));
log
The log tuple is a little different in that the value is another tuple where the first field is the log level and the second field is the log message e.g. ("log", ("FATAL", "This is an error message")). These show up as "Android Logs" in Perfetto.
Valid Log Levels
UNSPECIFIEDUNUSEDVERBOSEDEBUGINFOWARNERRORFATAL
Call Stack Sample
These are for logging call stacks (kernel, user, or both) at specific points in time. They do not have durations.
Required Fields:
pid(number)tid(number)ts(timestamp)kstackand/orustack(array of strings)
Optional Fields:
thread_name(string)
print(("call_stack",
    ("ts", nsecs),
    ("pid", pid),
    ("tid", tid),
    ("thread_name", comm),
    ("kstack", kstack),
    ("ustack", ustack)
));
stdout
This just prints the value to the command line e.g.
BEGIN {
    print(("stdout", "Tracks the duration of page faults"));
}
Dependencies
~4–12MB
~150K SLoC