24 releases
Uses new Rust 2024
| 0.10.4 | Mar 17, 2025 |
|---|---|
| 0.10.1 | Dec 14, 2024 |
| 0.10.0 | Nov 28, 2024 |
| 0.9.0 | Jul 17, 2024 |
| 0.1.7 | May 2, 2023 |
#105 in GUI
532 downloads per month
1MB
9K
SLoC
AMDGPU_TOP
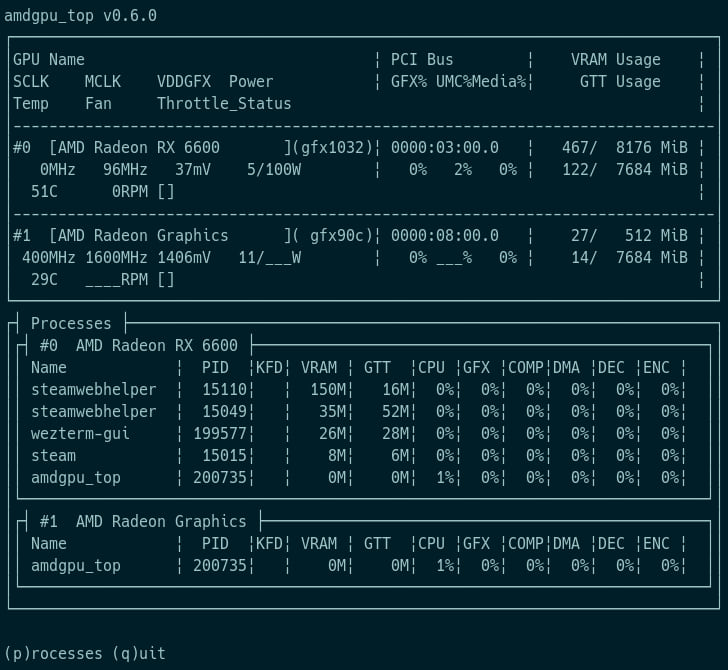
amdgpu_top is tool that display AMD GPU utilization, like umr or clbr/radeontop or intel_gpu_top.
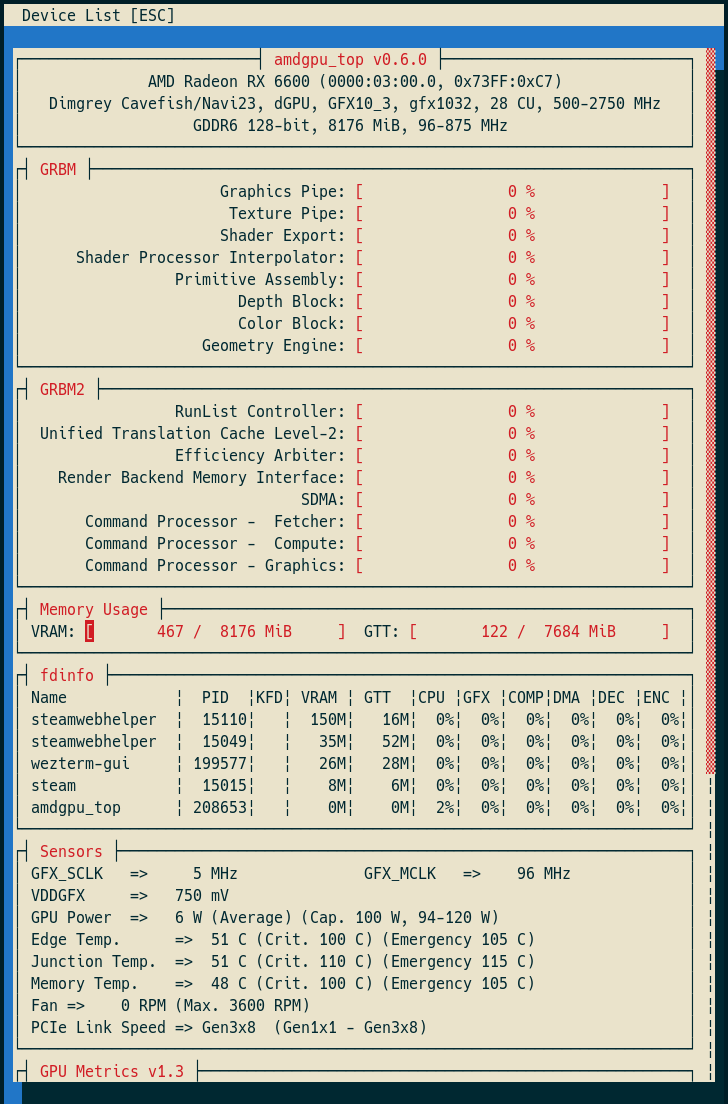
The tool displays information gathered from performance counters (GRBM, GRBM2), sensors, fdinfo, and AMDGPU driver.
| Simple TUI (like nvidia-smi, rocm-smi) |
TUI | GUI |
|---|---|---|
 |
 |
 |
Quick links
Dependent dynamic libraries
- libdrm
- libdrm_amdgpu
Usage
cargo run -- [options ..]
# or
amdgpu_top [options ..]
# Run TUI mode
amdgpu_top

# Run GUI mode
amdgpu_top --gui

# Run SMI mode
amdgpu_top --smi

# Dump AMDGPU info
amdgpu_top -d

# Dump AMDGPU info and gpu_metrics
amdgpu_top -d -gm

# Dump AMDGPU info and pp_table
amdgpu_top -d --pp-table

# Dump AMDGPU info in JSON format
amdgpu_top -d --json

# Dump DRM info
amdgpu_top --drm-info

# Decode gpu_metrics file
amdgpu_top --decode-gm <path>

# Decode gpu_metrics file and output in JSON format
amdgpu_top --json --decode-gm <path>
Options
FLAGS:
-d, --dump
Dump AMDGPU info. (Specifications, VRAM, PCI, ResizableBAR, VBIOS, Video caps)
This option can be combined with the "-J" option.
--list
Display a list of AMDGPU devices.
-J, --json
Output JSON formatted data.
This option can be combined with the "-d" option.
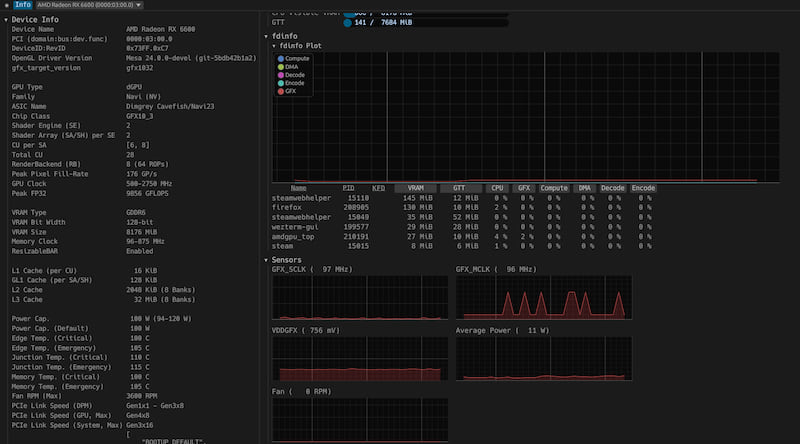
--gui
Launch GUI mode.
--smi
Launch Simple TUI mode. (like nvidia-smi, rocm-smi)
-p, --process
Dump All GPU processes and memory usage per process.
--apu, --select-apu
Select APU instance.
--single, --single-gpu
Display only the selected APU/GPU
--no-pc
The application does not read the performance counter (GRBM, GRBM2)
if this flag is set.
Reading the performance counter may deactivate the power saving feature of APU/GPU.
-gm, --gpu_metrics, --gpu-metrics
Dump gpu_metrics for all AMD GPUs.
https://www.kernel.org/doc/html/latest/gpu/amdgpu/thermal.html#gpu-metrics
--pp_table, --pp-table
Dump pp_table from sysfs and VBIOS for all AMD GPUs.
(only support Navi1x and Navi2x, Navi3x)
--drm_info, --drm-info
Dump DRM info.
Inspired by https://gitlab.freedesktop.org/emersion/drm_info
--xdna
Dump XDNA NPU info.
--dark, --dark-mode
Set to the dark mode. (TUI/GUI)
--light, --light-mode
Set to the light mode. (TUI/GUI)
--gl, --opengl
Use OpenGL API to the GUI backend.
--vk, --vulkan
Use Vulkan API to the GUI backend,
and use APU/iGPU for GUI rendering if it is available.
-V, --version
Print version information.
-h, --help
Print help information.
OPTIONS:
-i <usize>
Select GPU instance.
--pci <String>
Specifying PCI path. (domain:bus:dev.func)
-s <u64>, -s <u64>ms
Refresh period (interval) in milliseconds for JSON mode. (default: 1000ms)
-n <u32>
Specifies the maximum number of iteration for JSON mode.
If 0 is specified, it will be an infinite loop. (default: 0)
-u <u64>, --update-process-index <u64>
Update interval in seconds of the process index for fdinfo. (default: 5s)
--json_fifo, --json-fifo <String>
Output JSON formatted data to FIFO (named pipe) for other application and scripts.
--decode-gm <Path>, --decode-gpu-metrics <Path>
Decode the specified gpu_metrics file.
Commands for TUI
| key | |
|---|---|
| g | toggle GRBM |
| r | toggle GRBM2 |
| v | toggle VRAM/GTT Usage |
| f | toggle fdinfo |
| n | toggle Sensors |
| m | toggle GPU Metrics |
| h | change update interval (high = 100ms, low = 1000ms) |
| q | Quit |
| P | sort fdinfo by pid |
| M | sort fdinfo by VRAM usage |
| G | sort fdinfo by GFX usage |
| M | sort fdinfo by MediaEngine usage |
| R | reverse sort |
Example of using JSON mode
$ amdgpu_top --json | jq -c -r '(.devices[] |
  (.Info | .DeviceName + " (" + .PCI + "): ") +
  ([.gpu_activity | to_entries[] | .key + ": " + (.value.value|tostring) + .value.unit] |
  join(", ")))'
Output
AMD Radeon RX 6600 (0000:03:00.0): GFX: 13%, MediaEngine: 0%, Memory: 4%
AMD Radeon Graphics (0000:08:00.0): GFX: 0%, MediaEngine: 0%, Memory: null%
AMD Radeon RX 6600 (0000:03:00.0): GFX: 15%, MediaEngine: 0%, Memory: 5%
AMD Radeon Graphics (0000:08:00.0): GFX: 0%, MediaEngine: 0%, Memory: null%
AMD Radeon RX 6600 (0000:03:00.0): GFX: 3%, MediaEngine: 0%, Memory: 2%
AMD Radeon Graphics (0000:08:00.0): GFX: 0%, MediaEngine: 0%, Memory: null%
...
fdinfo description
fdinfo for the AMDGPU driver shows hardware IP usage per process.
VRAM
GTT
Graphics Translation Tables.
KFD
The process of using the AMDKFD driver.
GFX
GFX engine.
Compute/COMP
Compute engine.
The AMDKFD driver dose not track queues and does not show them in fdinfo.
DMA
DMA/SDMA (System DMA) engine.
Decode/DEC
Media decoder.
This is not show on RDNA 4.
Encode/ENC
Media encoder.
This is not show on RDNA 4.
VCN, Media
Media engine.
From VCN4, the encoding queue and decoding queue have been unified.
The AMDGPU driver handles both decoding and encoding as contexts for the encoding engine.
JPEG
JPEG decoder.
VPE
Video Processor Engine.
ref: https://gitlab.freedesktop.org/mesa/mesa/-/blob/main/src/amd/vpelib/README.md?ref_type=heads
Installation
Packages
- Releases
- .deb (generated by cargo-deb)
- .rpm (generated by cargo-generate-rpm)
- .AppImage (generated by cargo-appimage)
- AUR
- OpenMandriva to install run
sudo dnf install amdgpu_top - Nix
- Solus to install run
sudo eopkg it amdgpu_top
Build from source
cargo install amdgpu_top

# or

git clone https://github.com/Umio-Yasuno/amdgpu_top
cd amdgpu_top
cargo install --locked --path .
without GUI
cargo install --locked --path . --no-default-features --features="tui"
Distribution specific instructions
Debian/Ubuntu
sudo apt install libdrm-dev
Fedora
sudo dnf install libdrm-devel
Binary Size
| Features | Size (stripped) |
|---|---|
| json | ~1.1M |
| tui | ~1.5M |
| json, tui | ~1.7M |
| json, tui, gui | ~18M |
References
- Tom St Denis / umr · GitLab
- Mesa3D
- AMD Documentation
- https://github.com/AMDResearch/omniperf/tree/v1.0.4/src/perfmon_pub
- https://github.com/freedesktop/mesa-r600_demo
- radeonhd:r6xxErrata
- Linux Kernel AMDGPU Driver
- libdrm_amdgpu API
/drivers/gpu/drm/amd/amdgpu/amdgpu_kms.c
amdgpu_allowed_register_entry/drivers/gpu/drm/amd/amdgpu/{cik,nv,vi,si,soc15,soc21}.c
- libdrm_amdgpu API
Translations
amdgpu_top is using cargo-i18n with Project Fluent for translation.
Please refer to pop-os/popsicle for additional supported languages.
Supported Languages
Alternatives
If amdgpu_top is not enough for you or you don't like it, try the following applications.
AMD_DEBUG=info <opengl application>orRADV_DEBUG=info <vulkan application>- Print AMDGPU-related information
- https://docs.mesa3d.org/envvars.html#envvar-AMD_DEBUG
- https://docs.mesa3d.org/envvars.html#envvar-RADV_DEBUG
- clbr/radeontop
- View your GPU utilization, both for the total activity percent and individual blocks.
- Syllo/nvtop
- GPUs process monitoring for AMD, Intel and NVIDIA
- Tom St Denis / umr · GitLab
- User Mode Register Debugger for AMDGPU Hardware
- GPUOpen-Tools/radeon_gpu_profiler
- for developer
- Radeon GPU Profiler (RGP) is a tool from AMD that allows for deep inspection of GPU workloads.
Dependencies
~8–48MB
~795K SLoC