1 unstable release
| 0.1.0 | Aug 14, 2019 |
|---|
#17 in #timely-dataflow
10KB
125 lines

SnailTrail 2 (ST2)
SnailTrail 2 (ST2 for short) is a fork of SnailTrail, a tool to run online critical path analysis on various stream processors (see also the SnailTrail NSDI'18 Paper).
For in-depth information on its implementation, check out my thesis.
If you're looking for a light-weight alternative for analyzing only Timely & Differential Dataflows, check out st2 lite.
The fork builds upon the original repository and implements further algorithms for analyzing stream processors. It currently focuses on the 0.10 version of Timely Dataflow and Differential Dataflow and won't refrain from breaking existing upstream abstractions (even though they should be relatively easy to add back in at a later point in time).
Naming conventions
Similar to Timely Diagnostics, we will refer to the dataflow that is being analysed as the source computation. The workers of the dataflow that is being analysed are the source peers, while we unsurprisingly refer to ST2's workers as ST2 peers.
Getting Started
1. Attach ST2 to a source computation with st2-timely
Attach ST2 at (A) and (B) to any source computation (the example can be found at st2-timely/examples/minimal.rs):
use timely_adapter::connect::Adapter;

fn main() {
    timely::execute_from_args(std::env::args(), |worker| {
        // (A) Create SnailTrail adapter at the beginning of the worker closure
        let adapter = Adapter::attach(worker);

        // Some computation
        let mut input = InputHandle::new();
        let probe = worker.dataflow(|scope|
            scope.input_from(&mut input)
                 .exchange(|x| *x)
                 .inspect(move |x| println!("hello {}", x))
                 .probe()
        );

        for round in 0..100 {
            if worker.index() == 0 { input.send(round); }
            input.advance_to(round + 1);
            while probe.less_than(input.time()) { worker.step(); }

            // (B) Communicate epoch completion
            adapter.tick_epoch();
        }
    }).unwrap();
}
Make sure to place the adapter at the top of the timely closure. Otherwise, some logging events might not get picked up correctly by ST2.
2. Install the ST2 CLI (st2)
- Run
cargo install --path st2 st2from the project root. - Explore the CLI:
st2 --help
3. Inspect your computation
For example, we might want to see the online dashboard for an online 2 worker source computation using 2 ST2 peers:
- Run
st2 -i 127.0.0.1 -p 1234 -s 2 -w 2 dashboard. - Attach the source computation by running it with
SNAILTRAIL_ADDR="127.0.0.1:1234"as env variable. - Open
dashboard/index.htmlfrom the source root.
Commands
dashboardcreates an interactive ST2 dashboard. Optionally, it can be run with--epoch-max <MS> --message-max <MS> --operator-max <MS>, to specify max epoch, message, and operator durations for the integrated invariant checker.algoruns ST2's graph algorithms (currently, this is a k-hop graph pattern to detect bottleneck causes). Results are logged tostdout.invariantsruns ST2's invariant checker. Depending on flags passed (see--help), it checks max epoch, message, operator durations, as well as maximum time between two progress updates in a dataflow. Violations are logged tostdout.metricsexports aggregate metrics for the source computation (cf.docs/metricsfor examples). Try it out:st2 -f <path/to/dumps> -s <source peers> metrics-> checkmetrics.csv
Online vs. Offline
Differences
- In offline mode, the source computation is executed as usual — in online mode, you pass
SNAILTRAIL_ADDR=<IP>:<port>as environment variable. - In offline mode, you start the source computation first, then ST2 — vice versa in online mode.
- In offline mode, you pass
-f <path/to/dumps>as CLA — in online mode, you pass-i <IP>and-p <port>.
Usage example
Offline
- Run the source computation. This will generate
*.dumpfiles in yourpwd. - Analyze the generated offline trace with ST2:
st2 -f <path/to/dumps> -s <source peers> <subcommand>
Online:
- Run ST2:
st2 -i <IP> -p <port> -s <source peers> <subcommand> - Attach the source computation by running it with
SNAILTRAIL_ADDR=<IP>:<port>set as env variable.
Examples
Source Computations
Visit timely-adapter/examples for source computation examples.
Show me the code!
Check out the Structure section of this README for a high-level overview.
The "magic" mostly happens at
timely-adapter/src/connect.rsfor logging a computationtimely-adapter/src/lib.rsfor theLogRecordcreation,st2/src/pag.rsfor thePAGcreation, and theinspect.rscommand,triangles.rssource computation, andminimal.rssource computation tying it all together.- The various commands in
st2/src/commandsmake use of the PAG construction to run algorithms on top of it.
Structure
Overview
In this repository
| Type | Crate | Description |
|---|---|---|
| adapter | st2-timely |
timely / differential 0.9 adapter |
| infrastructure | st2-logformat |
Shared definitions of core data types and serialization of traces. |
| infrastructure, algorithms | st2 |
PAG generation & algorithms for timely with epochal semantics. |
Upstream
| Type | Crate | Description |
|---|---|---|
| adapter | spark-parser |
Spark adapter |
| adapter | tensorflow |
TensorFlow adapter |
| adapter | Flink | not publicly available |
| adapter | Timely < 0.9 | not publicly available |
| adapter | Heron | not publicly available |
| infrastructure | logformat |
Shared definitions of core data types and serialization of traces (in Rust, Java). |
| infrastructure | pag-construction |
Constructs the Program Activity Graph (PAG) from a flat stream of events which denote the start/end of computation and communication. Also has scripts to generate various plots. |
| algorithms | snailtrail |
Calculates a ranking for PAG edges by computing how many times an edge appears in the set of all-pairs shortest paths ("critical participation", cf. the paper). |
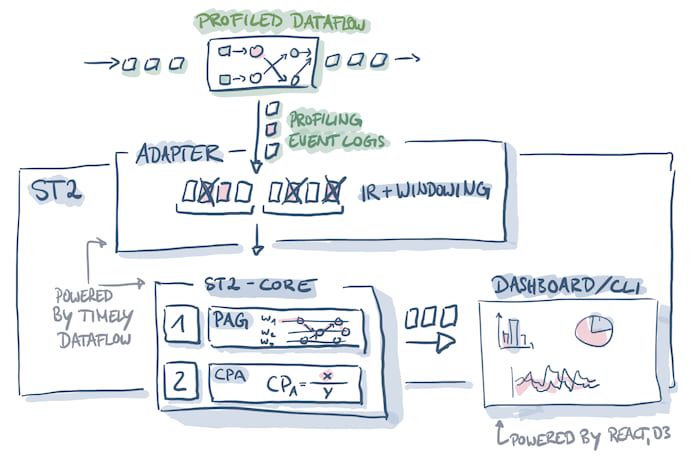
Adapters
Adapters read log traces from a stream processor (or a serialized representation) and convert the logged messages to logformat's LogRecord representation. This representation can then be used for PAG construction.
Depending on the stream processor, window semantics also come into play here. For example, the timely-adapter currently uses an epoch-based window, which should make many algorithms on the PAG easier than working on a fixed window PAG.
Infrastructure
Glue code, type definitions, (de)serialization, and intermediate representations that connect adapters to algorithms.
Algorithms
Implementation of various algorithms that run on top of the PAG to provide insights into the analyzed distributed dataflow's health and performance. Run the dashboard subcommand to see a nice summary of graph patterns, invariants, and aggregate metrics we compute.
Docs
See the docs subfolder for some additional documentation. Of course, also check out the examples and code documentation built with cargo doc.
Resources
- Malte Sandstede: Online Analysis of Distributed Dataflows (TUM '19)
- Hoffmann et al.: SnailTrail Paper (NSDI '18)
- Malte Sandstede: A Short Introduction to SnailTrail (ETH '19)
- Vasia Kalavri: Towards self-managed, re-configurable streaming dataflow systems (UGENT '19)
- Moritz Hoffmann: SnailTrail: Generalizing Critical Paths for Online Analysis of Distributed Dataflows (NSDI '18)
- Vasia Kalavri: Online performance analysis of distributed dataflow systems (O'Reilly Velocity London '18)
License
ST2 is primarily distributed under the terms of both the MIT license and the Apache License (Version 2.0), with portions covered by various BSD-like licenses.
See LICENSE-APACHE, and LICENSE-MIT for details.
lib.rs:
Data structure for a LogRecord, Pair two-dimensional time type.
A LogRecord constitutes the unified struct representation of
log messages from various stream processors.
It is the underlying structure from which the PAG construction starts.
Dependencies
~4MB
~66K SLoC