2 releases
| 0.1.1 | Mar 17, 2022 |
|---|---|
| 0.1.0 | Mar 17, 2022 |
#379 in Profiling
22KB
472 lines
Perf-tools
Rust library for Linux perf.
The current feature is converting a perf.data file (CPU profiling) generated by the perf Linux profiler, into data for Google pprof tool.
I tried Google's perf_data_converter but seems that it doesn't support dwarf stacks. So I tried to start from scratch in Rust rather than playing with the C++ code.

Installation
cargo install perf-tools
Usage
If you already have a perf.data file, just run perf2pprof command:
$ ls
Cargo.lock  Cargo.toml  cpu.pprof  perf.data  src  target
$ perf2pprof
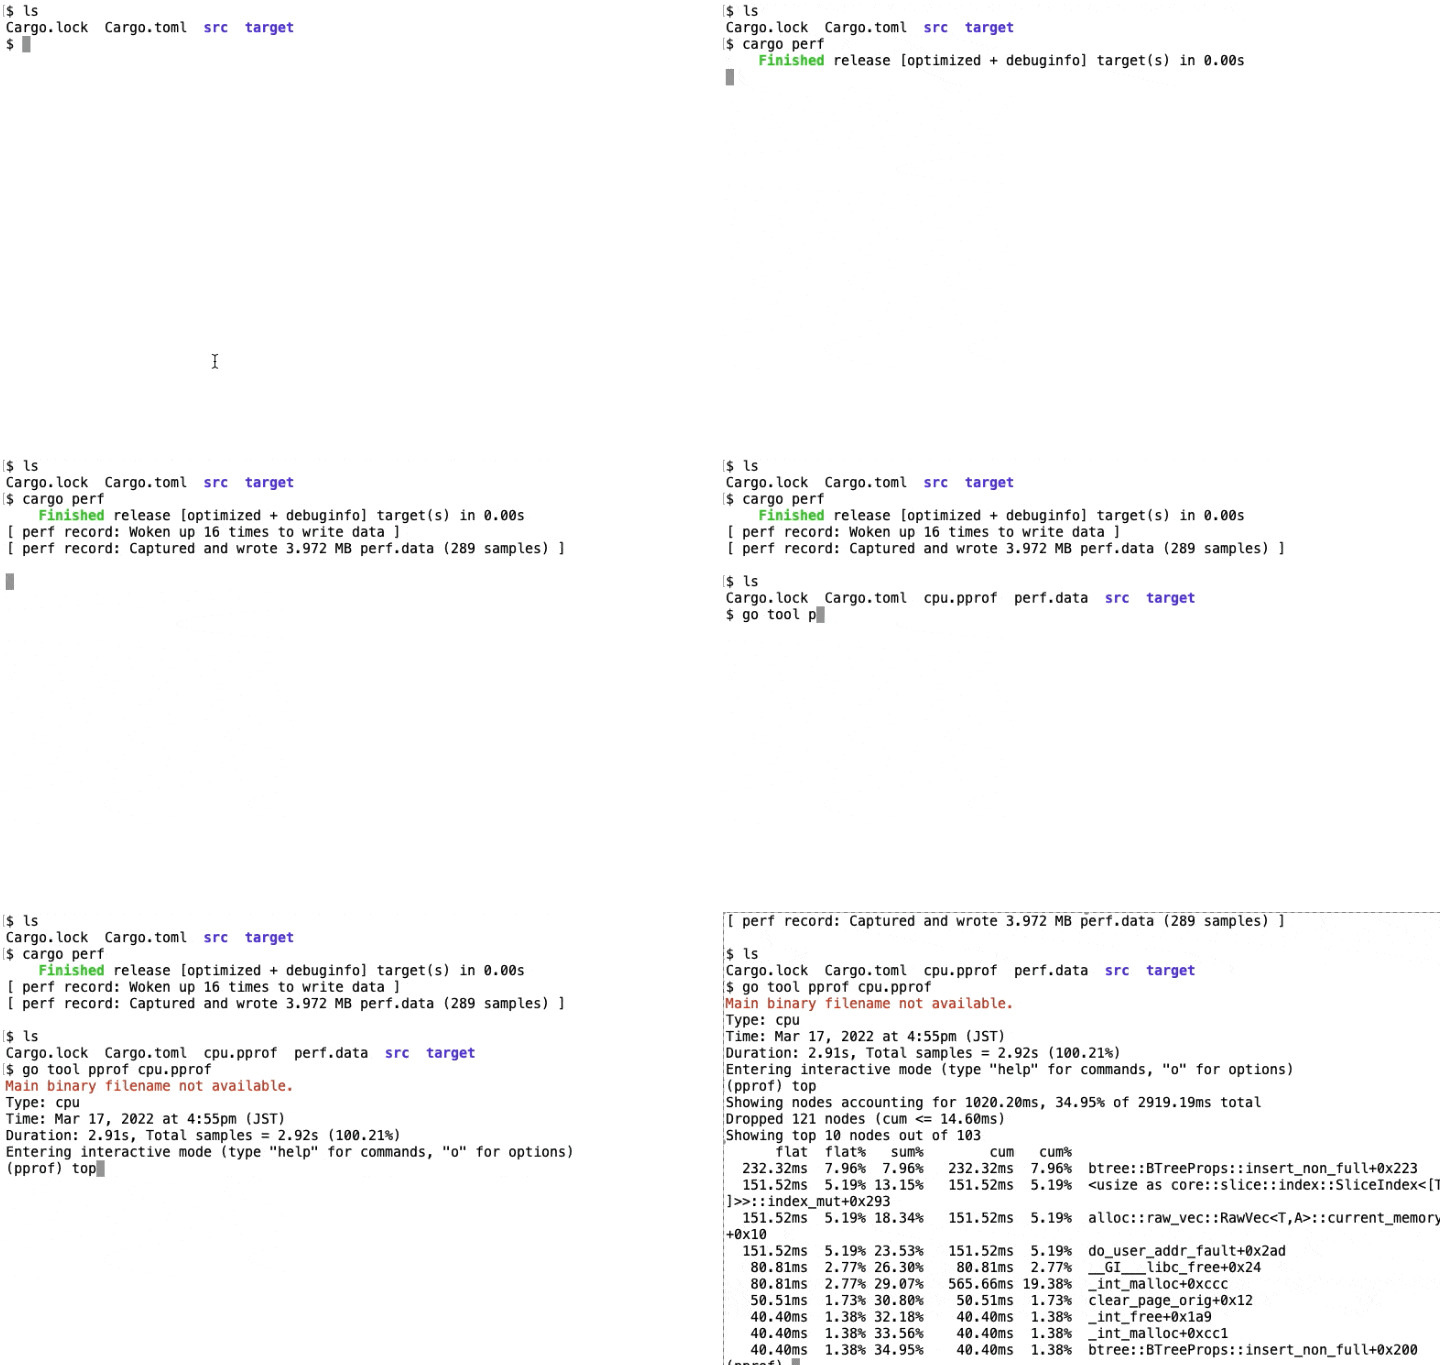
cargo perf command does everything as the above picture shows if you haven't run perf command yet.
Preparation
Firstly, better to have debugging symbols for the GNU C library (libc6-dbg package in Ubuntu).
Secondly, the following configuration might be necessary:
$ sudo sysctl -w kernel.kptr_restrict=0
$ echo -1 | sudo tee /proc/sys/kernel/perf_event_paranoid
Lastly, put the following in your Cargo.toml file:
[profile.release]
debug = true
Caveat
Only a minimum of information are converted. It's on my to-do list. Of course, pull requests are very welcome.
Dependencies
~10–19MB
~253K SLoC