28 releases
| 0.1.20 | Mar 27, 2023 |
|---|---|
| 0.1.18 | Aug 8, 2022 |
| 0.1.17 | Jul 10, 2022 |
| 0.1.15 | Mar 21, 2022 |
| 0.0.7 | Nov 30, 2020 |
#1063 in Network programming
6.5MB
2.5K
SLoC
![]()
![]()
![]()
![]()
Overview
Benchmarking tool for network services. Currently, limited to HTTP only (H1 or H2, over TCP or TLS). However, it's easily extendable to other protocols.
It works in the following modes:
ab-like mode. Just send traffic to an endpoint for a given duration, or a number of requests.- Unlimited request rate (to find the max throughput).
- Choose the request rate and concurrency level.
- Measurements are down to
µs.
- Increase the request rate linearly, e.g. by
1,000every minute to see how your service scales with load. - It can report metrics to
Prometheusvia apushgateway.
For instance: 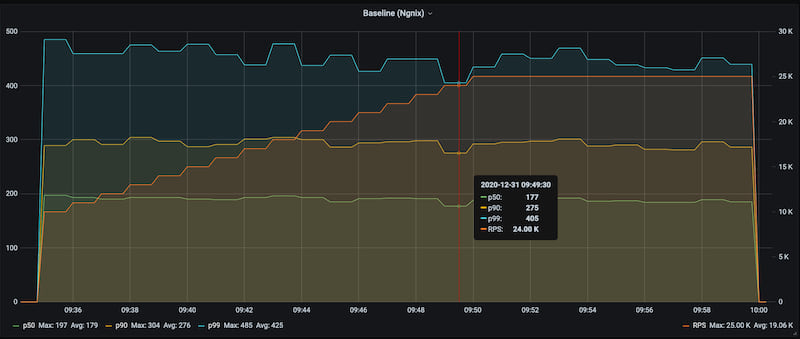 .
.
Emitted metrics are:
request_count- counter for all requestssuccess_count- counter for only successful requestsbytes_count- total bytes transferredresponse_codes- counters for response codes (200, 400, etc.)success_latency- latency histogram of successful requests onlyerror_latency- latency histogram of failed requests (if any)throughput- throughput histogram of successful requests onlylatency- latency histogram across all requestslatency_{statistic}-{statistic} = {min, mean, max, stddev, p50, p90, p99, p99_9, p99_99, tm99, tm99.9, tm99.99}- gauges for latency statistics
For instance, benchmarking TCP proxies in different languages: C, C++, Rust, Golang, Java, Python.
Installation
For MacOS, Ubuntu, Windows you can use the binaries in the release section.
Alternatively you can build it on your machine:
Install cargo - follow these instructions.
On Debian to fix OpenSSL build issue. E.g. on Debian:
sudo apt-get install pkg-config libssl-dev
on Red-Hat:
sudo dnf install pkg-config openssl-devel
# or
sudo yum install pkg-config openssl-devel
Then:
$ cargo install perf-gauge --features full
Supported features:
default- if no features specified, onlyhttptraffic is supportedtls-native- TLS support (based onOpenSSL)tls-boring- TLS support (based onBoringSSL). Doesn't support self-signed certs.report-to-prometheus- to supportPrometheusfor metric collectionfull-report-to-prometheus+tls-nativefull-boring-report-to-prometheus+tls-boring
Usage
$ perf-gauge help
Gauging performance of network services. Snapshot or continuous, supports Prometheus metrics.

USAGE:
    perf-gauge [OPTIONS] <SUBCOMMAND>

OPTIONS:
    -c, --concurrency <CONCURRENCY>
            Concurrent clients. Default `1` [default: 1]

        --continuous
            If it's a part of a continuous run. In this case metrics are not reset at the end to
            avoid saw-like plots

    -d, --duration <DURATION>
            Duration of the test

    -h, --help
            Print help information

    -m, --max_iter <MAX_ITER>
            takes_value "The number of iterations with the max rate. By default `1` [default: 1]

    -n, --num_req <NUM_REQ>
            Number of requests per client

    -N, --name <NAME>
            Test case name. Optional. Can be used for tagging metrics

        --prometheus <PROMETHEUS>
            If you'd like to send metrics to Prometheus PushGateway, specify the server URL. E.g.
            10.0.0.1:9091

        --prometheus_job <PROMETHEUS_JOB>
            Prometheus Job (by default `pushgateway`)

    -r, --rate <RATE>
            Request rate per second. E.g. 100 or 0.1. By default no limit

        --rate_max <RATE_MAX>
            Max rate per second. Requires --rate-step

        --rate_step <RATE_STEP>
            Rate increase step (until it reaches --rate_max)

        --request_timeout <REQUEST_TIMEOUT>
           Timeout of a single request. E.g. "--request_timeout 30s". Timeouts are treated as fatal
           errors

    -V, --version
            Print version information

SUBCOMMANDS:
    help    Print this message or the help of the given subcommand(s)
    http    Run in HTTP(S) mode
Help for the http command:
$ perf-gauge help http
Run in HTTP(S) mode

USAGE:
    perf-gauge http [OPTIONS] [TARGET]...

ARGS:
    <TARGET>...    Target, e.g. https://my-service.com:8443/8kb Can be multiple ones (with
                   random choice balancing)


OPTIONS:
    -B, --body <BODY>                Body of the request. Could be either `random://[0-9]+`,
                                     `file://$filename` or `base64://${valid_base64}`. Optional
        --conn_reuse                 If connections should be re-used
    -E, --error_stop <ERROR_STOP>    Stop immediately on error codes. E.g. `-E 401 -E 403`
    -h, --help                       Print help information
    -H, --header <HEADER>            Headers in \"Name:Value1\" form. Can be provided multiple
                                     times. It can contain multiple values, e.g.
                                     \"Name:Value1:Value2:Value3\". In this case a random one is
                                     chosen for each request
        --http2_only                 Enforce HTTP/2 only
        --ignore_cert                Allow self signed certificates
    -M, --method <METHOD>            Method. By default GET
    -V, --version                    Print version information
For example, test an endpoint using a single run, 5 seconds (max possible request rate):
$ perf-gauge --concurrency 10 \
               --duration 1m \
               http http://localhost/10kb --conn_reuse
Parameters:
--concurrency 10- the number of clients generating load concurrently--duration 1m- step duration1m(or10s,5m, etc.)http http://local-nginx.org/10kb --conn_reuse- run inhttpmode to the given endpoint, reusing connections.
Reporting performance metrics to Prometheus
Another use case, is to increase request rate and see how the latency degrades.
E.g. increase RPS each minute by 1,000:
export PROMETHEUS_HOST=10.138.0.2

$ perf-gauge --concurrency 10 \
               --request_timeout 30s \
               --rate 1000 --rate_step 1000 --rate_max 25000 \
               --max_iter 15 \
               --duration 1m \
               --name nginx-direct \
               --prometheus $PROMETHEUS_HOST:9091 \
               http https://localhost/10kb --conn_reuse --ignore_cert
--concurrency 10- the number of clients generating load concurrently--request_timeout 30s- do not wait for response longer than 30 seconds and stop execution on timeouts.--rate 1000 --rate_step 1000 --rate_max 25000- start with rate 1000 rps, then add 1000 rps after each step until it reaches 25k.--duration 1m- step duration1m--max_iter 15- perform15iterations at the max rate--name nginx-direct- the name of the test (used for reporting metrics toprometheus)--prometheus $PROMETHEUS_HOST:9091- push-gatewayhost:portto send metrics to Prometheus.http http://local-nginx.org/10kb --conn_reuse- run inhttpsmode to the given endpoint, reusing connections and not checking the certificate.
Dependencies
~12–32MB
~548K SLoC