1 unstable release
| 0.1.1 | Jul 8, 2021 |
|---|
#2818 in Development tools
38KB
824 lines
cosmoline
What is it?
Cosmoline is a quick and dirty code coverage report generator for rust. It takes advantage of the source-based code coverage that landed in nightly back in November 2020.
How does it work?
Input: JSON from llvm-cov export (or its convenient wrapper cargo cov)
Output: Pretty HTML reports are rendered with handlebars-rs. The templates are located in the template directory and compiled into the cosmoline binary.
How do I use it?
Install the prerequsities
Instructions on how to configure nightly to build profiling data in the Rust Unstable Book.
Install jq (useful, but not strictly necessary):
On e.g. macOS:
brew install jq
Or Debian:
sudo apt-get install jq
Or FreeBSD:
sudo pkg install jq
Build and install cosmoline
# Check out this repo
git clone https://github.com/inferiorhumanorgans/cosmoline

# Install it with cargo
cargo +nightly install --path ./cosmoline
Export the JSON coverage data
For a single library from llvm using jq:
# Back in the directory for our own project
cd /path/to/my-app
export OUT_DIR="$(PWD)/coverage-report"
export APP_NAME="my-app"

# Run tests, save results as JUnit data
LLVM_PROFILE_FILE="${OUT_DIR}/${APP_NAME}-%m.profraw" RUSTFLAGS="-Z instrument-coverage" cargo +nightly test --lib -- -Z unstable-options --format=junit > ${OUT_DIR}/junit.xml

# Grab test executable
COV_EXEC=$(RUSTFLAGS="-Z instrument-coverage" cargo +nightly test --message-format=json --lib --no-run | jq -r "select(.profile.test == true) | .filenames[]" | head -1)

# Merge sparse files
cargo +nightly profdata -- merge --sparse "${OUT_DIR}/${APP_NAME}-"*.profraw -o "${OUT_DIR}/${APP_NAME}.profdata"

# Extract JSON formatted details
cargo +nightly cov -- export "${COV_EXEC}" -instr-profile="${OUT_DIR}/${APP_NAME}.profdata" > "${OUT_DIR}/${APP_NAME}.coverage.json"
Feed it into cosmoline
cosmoline --input "${OUT_DIR}/${APP_NAME}.coverage.json" --source-directory "$(PWD)" --output-directory "${OUT_DIR}/report"
The resulting report is self-contained and will be placed in ${OUT_DIR}/report/index.html.
View the results
A typical report might look like this:

Note that the percentages listed will be colored red, yellow, or green depending on the proportion of the file that's been covered.
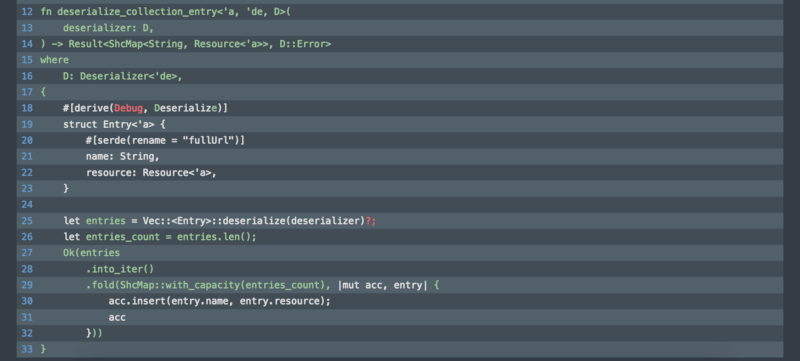
Clicking on a filename will take you to an annotated rendering of that file's contents:

Code that's been instrumented is highlighted in red if it was not executed and green if the code's been executed. Code that has not been instrumented remains white.
TODO
- render clippy warnings?
- refactor CSS
- include cargo and git metadata
Dependencies
~8–17MB
~225K SLoC