1 stable release
Uses old Rust 2015
| 1.0.0 | May 2, 2018 |
|---|
#13 in #standard-deviation
38KB
937 lines
benchpmc
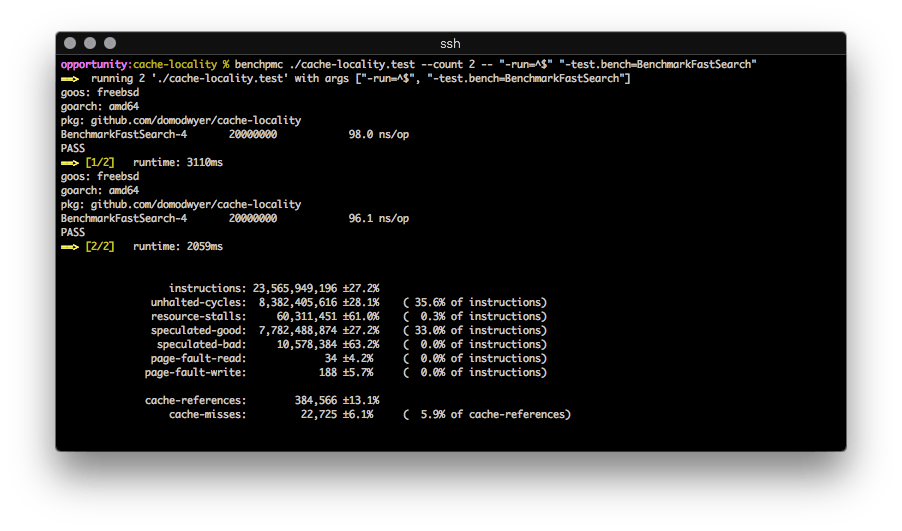
A black-box benchmark runner utilising the PMCs (Performance Monitor Counters) present in most x86 CPUs.
Repeatedly runs a binary, calculating the average value and relative standard deviation of the configured counters. It looks exactly like this:
Users can specify different PMCs to measure, though they must be capable of per-process operation (some are system-scope only).
This is built on top of the FreeBSD hwpmc kernel module, so you'll need that too.
PMCs?
PMCs are part of the CPU hardware and are typically used to profile CPU micro-architecture events for a particular application or algorithm. Using PMCs an algorithm can be tuned for performance by minimising CPU stalls, optimising CPU cache usage, etc.
The events are defined by the CPU manufacturer (here is the Intel 64 and
IA-32 Architectures Developer's Manual: vol.
3B
where the events can be found in section 18.2.1.2 "Pre-defined Architectural Performance Events", Table 18-1 "UMask and Event Select Encodings for Pre-Defined Architectural Performance Events").
Why?
I do a lot of benchmarking on FreeBSD for work, and I was missing the linux perf tool's quick stats overview. FreeBSD ships with pmcstat which is pretty cool, but I really wanted the ability to repeatedly run a binary and get a good, quick overview while tuning.
And I wanted to build something with rust.
Analysing with benchpmc
In this example we'll analyse a simple pre-compiled Golang benchmark comparing two competing algorithms Sample A and Sample B (compile stdlib benchmarks with go test -c)
First we need a general idea of the two algorithm's performance:
benchpmc ./algorithms.test -- "-run=^$" "-test.bench=BenchmarkSampleA"`
Sample A:
                  instructions: 19,031,333,328 ±0.0%
               unhalted-cycles:  7,002,094,130 ±4.2%     ( 36.8% of instructions)
               resource-stalls:    175,771,059 ±68.2%    (  0.9% of instructions)
               speculated-good:  6,285,556,182 ±0.0%     ( 33.0% of instructions)
                speculated-bad:     19,662,434 ±68.7%    (  0.1% of instructions)
               page-fault-read:             28 ±0.0%     (  0.0% of instructions)
              page-fault-write:            170 ±0.0%     (  0.0% of instructions)

              cache-references:        202,174 ±4.0%
                  cache-misses:         10,756 ±30.7%    (  5.3% of cache-references)
Sample B:
                  instructions: 15,185,065,698 ±0.0%
               unhalted-cycles:  5,436,809,490 ±0.4%     ( 35.8% of instructions)
               resource-stalls:  1,312,015,320 ±1.5%     (  8.6% of instructions)
               speculated-good:  2,509,454,558 ±0.0%     ( 16.5% of instructions)
                speculated-bad:      2,376,762 ±69.7%    (  0.0% of instructions)
               page-fault-read:             28 ±0.0%     (  0.0% of instructions)
              page-fault-write:            170 ±0.0%     (  0.0% of instructions)

              cache-references:        178,634 ±2.0%
                  cache-misses:         11,103 ±31.1%    (  6.2% of cache-references)
There's little difference between the two algorithms, and indeed the runtime
(not displayed) is pretty similar for both (Sample A is ~100ns faster), but
lets explore the reason for the relative 8% increase in resource stalls to
highlight the granularity of PMCs.
Measure the RESOURCE_STALLS specific events with benchpmc:
benchpmc ./algorithms.test --event="RESOURCE_STALLS.ANY" \
--event="RESOURCE_STALLS.LB" --event="RESOURCE_STALLS.SB" \
--event="RESOURCE_STALLS.ROB" --event="RESOURCE_STALLS.FCSW" \
--event="RESOURCE_STALLS.MXCSR" -- \
"-run=^$" "-test.bench=BenchmarkSampleA"
Sample A:
           RESOURCE_STALLS.ANY:    183,901,679 ±65.3%
            RESOURCE_STALLS.LB:     94,318,196 ±65.8%
            RESOURCE_STALLS.SB:        432,623 ±5.3%
           RESOURCE_STALLS.ROB:        196,738 ±7.5%
          RESOURCE_STALLS.FCSW:              0
         RESOURCE_STALLS.MXCSR:              0
Sample B:
           RESOURCE_STALLS.ANY:  1,309,699,802 ±2.8%
            RESOURCE_STALLS.LB:  1,308,448,313 ±2.8%
            RESOURCE_STALLS.SB:      1,331,845 ±33.1%
           RESOURCE_STALLS.ROB:        213,417 ±11.9%
          RESOURCE_STALLS.FCSW:              0
         RESOURCE_STALLS.MXCSR:              0
The huge difference in RESOURCE_STALLS.LB shows execution is stalling because
all of the CPU's memory load buffers are overloaded pulling data from the L1 cache.
After first checking the L1/L2/LLC hits to ensure there were relatively even
distribution between the two samples, it became clear that Sample B was
performing more L1 cache reads relative to Sample A and there were a lot of
bank conflicts occurring within the L1 cache, a Sandy Bridge specific issue:
Sample A:
   MEM_LOAD_UOPS_RETIRED.L1_HIT:  3,491,840,931 ±0.0%
   MEM_LOAD_UOPS_RETIRED.L2_HIT:         19,813 ±4.1%
  MEM_LOAD_UOPS_RETIRED.LLC_HIT:         28,959 ±4.7%
L1D_BLOCKS.BANK_CONFLICT_CYCLES:      7,532,592 ±44.2%
Sample B:
   MEM_LOAD_UOPS_RETIRED.L1_HIT:  5,022,114,366 ±0.0%
   MEM_LOAD_UOPS_RETIRED.L2_HIT:         18,528 ±5.3%
  MEM_LOAD_UOPS_RETIRED.LLC_HIT:         24,369 ±3.5%
L1D_BLOCKS.BANK_CONFLICT_CYCLES:     53,973,890 ±12.4%
This suggests we're operating on a "hot" dataset that fits entirely within the
L1 cache in a very tight loop, and the memory access pattern in Sample B is
causing lots of blocking L1 reads partially due to bank conflicts: an increase
of 7.1x, which fits almost exactly with the observed RESOURCE_STALLS.ANY
increase when you take into account the overhead of the additional L1 reads.
PMCs are crazy powerful right?
Installation
Either download a binary from the releases page, or compile your own with cargo build. Obviously a FreeBSD box is needed as it makes use of the hwpmc kernel module.
I don't expect this to be outstandingly popular (talk about a niche market...) but if it was useful or you have questions, feel free to drop me an email!
Dependencies
~4MB
~68K SLoC