4 releases (2 breaking)
| 0.3.1 | Oct 24, 2020 |
|---|---|
| 0.3.0 | Oct 24, 2020 |
| 0.2.0 | Dec 23, 2019 |
| 0.0.1 | Aug 23, 2019 |
#9 in #actix-middleware
330KB
417 lines
actix-web-metrics-mw
Generic middleware library for actix-web metrics aggregation, can send to various outlets.
[
Metrics middleware instrumentation for actix-web using the metrics-rs crate .
By default two metrics are tracked (this assumes the namespace actix_web_metrics_mw):
Available exporters :
- Statsd : uses a statsd rust client that buffers metrics through UDP, dogstats format is supported for metric labels
Default metrics :
http_requests_total(labels: endpoint, method, status): request counter for each endpoint and method.http_requests_duration(labels: endpoint, method, status): histogram of request durations for each endpoint.
Dependencies
- actix 2
- futures 0.3
- metrics 0.12
Issues
Please feel free to submit issues for evolutions you feel are necessary.
Usage
First add actix_web_metrics_mw to your Cargo.toml:
[dependencies]
actix_web_metrics_mw = "0.2.0"
You then instantiate the prometheus middleware and pass it to .wrap():
use actix_web::{web, App, HttpResponse, HttpServer};
use actix_web_metrics_mw::Metrics;

fn health() -> HttpResponse {
    HttpResponse::Ok().finish()
}

fn main() -> std::io::Result<()> {
    let metrics = Metrics::new("/metrics", "actix_web_mw_test");
    HttpServer::new(move || {
        App::new()
            .wrap(metrics.clone())
            .service(web::resource("/health").to(health))
    })
    .bind("127.0.0.1:8080")?
    .run();
    Ok(())
}
Using the above as an example, a few things are worth mentioning:
apiis the metrics namespace/metricswill be auto exposed (GET requests only)
A call to the /metrics endpoint will expose your metrics:
$ curl http://localhost:8080/metrics
{"http_requests_total":"1570","http_requests_duration":"[0, 0, 0, 0, 0, 0, 0, 0, 0, 0, 0, 0, 0, 0, 0, 0, 0, 0, 0, 0, 0, 0, 0, 0, 0, 0, 0, 0, 0, 0, 0, 0, 0, 0, 0, 0, 0, 0, 0, 0, 0, 0, 0, 0, 0, 0, 0, 0, 0, 0, 0, 0, 0, 0, 0, 0, 0, 0, 0, 0, 0, 0, 0, 0, 0, 0, 0, 0, 0, 0, 0, 0, 0, 0, 0, 0, 0, 0, 0, 0, 0, 0, 0, 0, 0, 0, 0, 0, 0, 0, 0, 0, 0, 0, 0, 0, 0, 0, 0, 0, 0, 0, 0, 0, 0, 0, 0, 0, 0, 0, 0, 0, 0, 0, 0, 0, 0, 0, 0, 0, 0, 0, 0, 0, 0, 0, 0, 0, 0, 0, 0, 0, 0, 0, 0, 0, 0, 0, 0, 0, 0, 0, 0, 0, 0, 0, 0, 0, 0, 0, 0, 0, 0, 0, 0, 0, 0, 0]"}
Custom metrics
You can instantiate Metrics and then use its sink to register your custom
metric.
You can also use the metrics library macros or the entire metrics runtime to add new metrics and labels as suit your needs.
use actix_web::{web, App, HttpResponse, HttpServer};
use actix_web_metrics_mw::Metrics;

fn health() -> HttpResponse {
    counter!("endpoint.method.status", 1);
    HttpResponse::Ok().finish()
}

fn main() -> std::io::Result<()> {
    let metrics = Metrics::new("/metrics", "actix_web_mw_test");

    HttpServer::new(move || {
        App::new()
            .wrap(metrics.clone())
            .service(web::resource("/health").to(health))
    })
    .bind("127.0.0.1:8080")?
    .run();
    Ok(())
}
Live functional testing
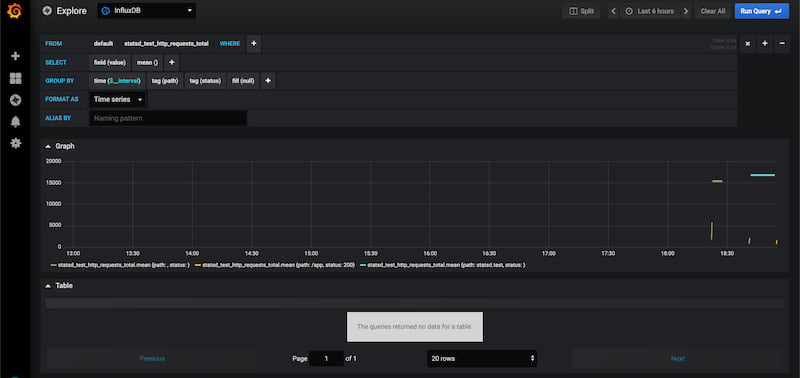
Use the docker-compose file. Actual result :

Special Thanks
- The middleware integration is influenced by the work in nlopes/actix-web-prom.
Dependencies
~33MB
~657K SLoC