21 releases
| 0.6.3 | Apr 26, 2024 |
|---|---|
| 0.6.1 | Mar 23, 2024 |
| 0.5.1 | Oct 11, 2023 |
| 0.4.0 | Jul 3, 2023 |
| 0.2.4 | Oct 13, 2021 |
#65 in Math
620 downloads per month
Used in 10 crates
575KB
5.5K
SLoC
Rust plotting library using Python (Matplotlib)
![]()
Contents
Introduction
This crate implements high-level functions to generate plots and drawings. Although we use Python/Matplotlib, the goal is to provide a convenient Rust library that is different than Matplotlib. The difference happens because we want convenience for the Rust developer while getting the fantastic quality of Matplotlib 😀.
Internally, we use Matplotlib via a Python 3 script. First, we generate a python code in a directory of your choice (e.g., /tmp/plotpy), and then we call python3 using Rust's std::process::Command.
For more information (and examples), check out the plotpy documentation on docs.rs.
See also the examples directory with the output of the integration tests.
Installation on Debian/Ubuntu/Linux
This crate needs Python3 and Matplotlib, of course.
On Debian/Ubuntu/Linux, run:
sudo apt install python3-matplotlib
Setting Cargo.toml
![]()
👆 Check the crate version and update your Cargo.toml accordingly:
[dependencies]
plotpy = "*"
Examples
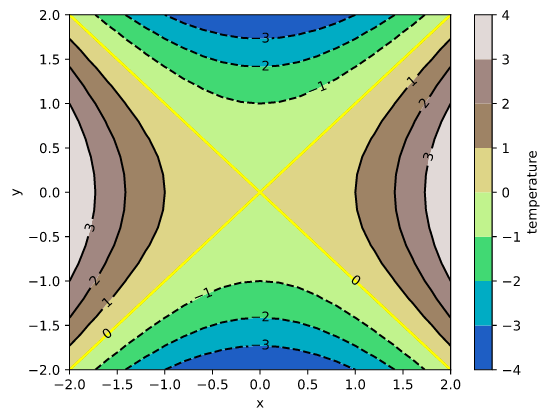
Contour
use plotpy::{generate3d, Contour, Plot, StrError};

fn main() -> Result<(), StrError> {
    // generate (x,y,z) matrices
    let n = 21;
    let (x, y, z) = generate3d(-2.0, 2.0, -2.0, 2.0, n, n, |x, y| x * x - y * y);

    // configure contour
    let mut contour = Contour::new();
    contour
        .set_colorbar_label("temperature")
        .set_colormap_name("terrain")
        .set_selected_level(0.0, true);

    // draw contour
    contour.draw(&x, &y, &z);

    // add contour to plot
    let mut plot = Plot::new();
    plot.add(&contour);
    plot.set_labels("x", "y");

    // save figure
    plot.save("/tmp/plotpy/readme_contour.svg")?;
    Ok(())
}
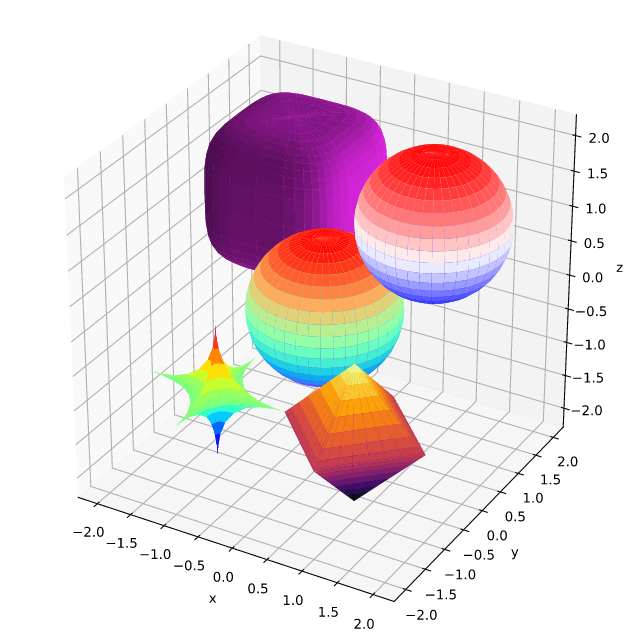
Superquadric
use plotpy::{Plot, StrError, Surface};

fn main() -> Result<(), StrError> {
    // star
    let r = &[1.0, 1.0, 1.0];
    let c = &[-1.0, -1.0, -1.0];
    let k = &[0.5, 0.5, 0.5];
    let mut star = Surface::new();
    star.set_colormap_name("jet")
        .draw_superquadric(c, r, k, -180.0, 180.0, -90.0, 90.0, 40, 20)?;

    // pyramids
    let c = &[1.0, -1.0, -1.0];
    let k = &[1.0, 1.0, 1.0];
    let mut pyramids = Surface::new();
    pyramids
        .set_colormap_name("inferno")
        .draw_superquadric(c, r, k, -180.0, 180.0, -90.0, 90.0, 40, 20)?;

    // rounded cube
    let c = &[-1.0, 1.0, 1.0];
    let k = &[4.0, 4.0, 4.0];
    let mut cube = Surface::new();
    cube.set_surf_color("#ee29f2")
        .draw_superquadric(c, r, k, -180.0, 180.0, -90.0, 90.0, 40, 20)?;

    // sphere
    let c = &[0.0, 0.0, 0.0];
    let k = &[2.0, 2.0, 2.0];
    let mut sphere = Surface::new();
    sphere
        .set_colormap_name("rainbow")
        .draw_superquadric(c, r, k, -180.0, 180.0, -90.0, 90.0, 40, 20)?;

    // sphere (direct)
    let mut sphere_direct = Surface::new();
    sphere_direct.draw_sphere(&[1.0, 1.0, 1.0], 1.0, 40, 20)?;

    // add features to plot
    let mut plot = Plot::new();
    plot.add(&star)
        .add(&pyramids)
        .add(&cube)
        .add(&sphere)
        .add(&sphere_direct);

    // save figure
    plot.set_equal_axes(true)
        .set_figure_size_points(600.0, 600.0)
        .save("/tmp/plotpy/readme_superquadric.svg")?;
    Ok(())
}